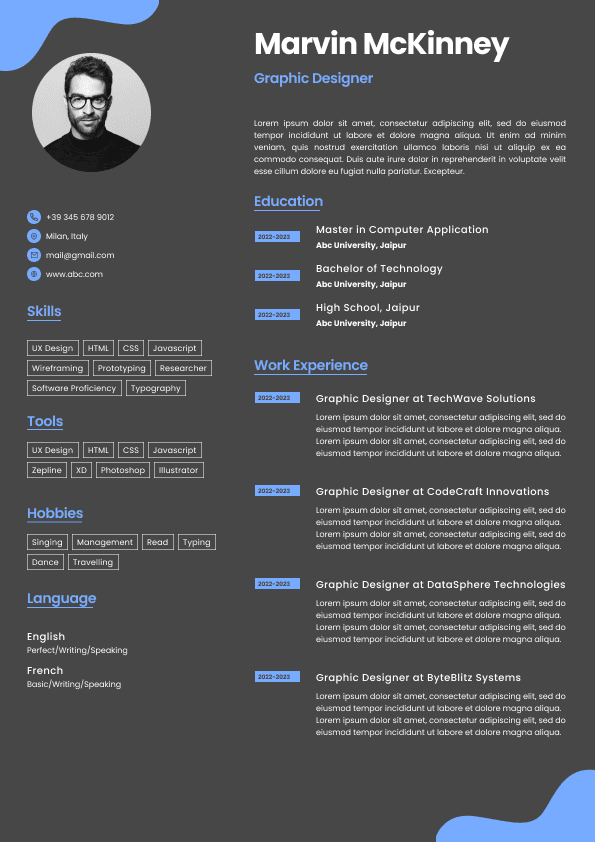
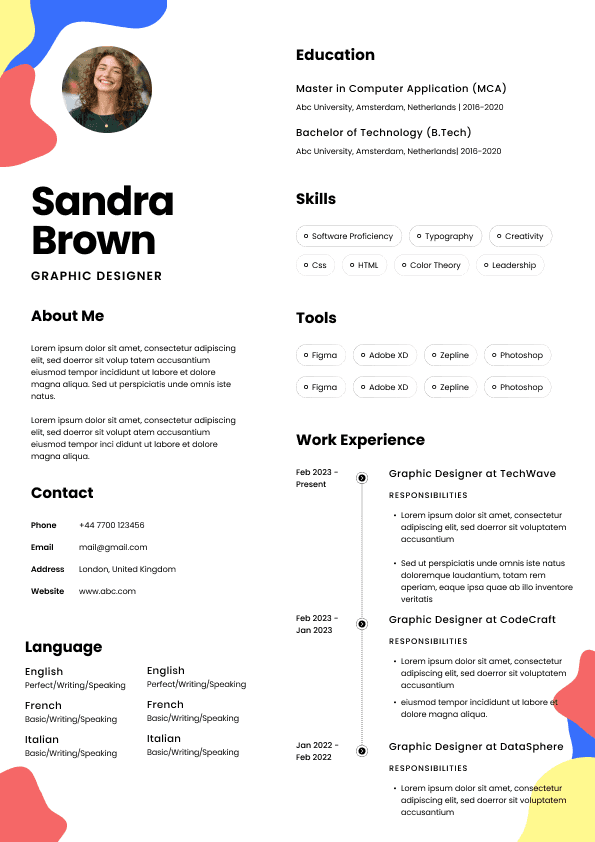
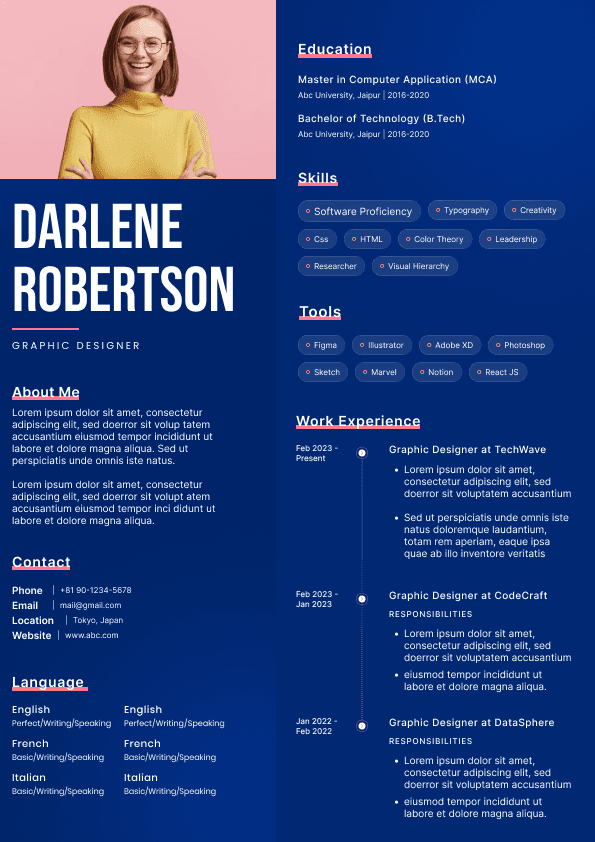
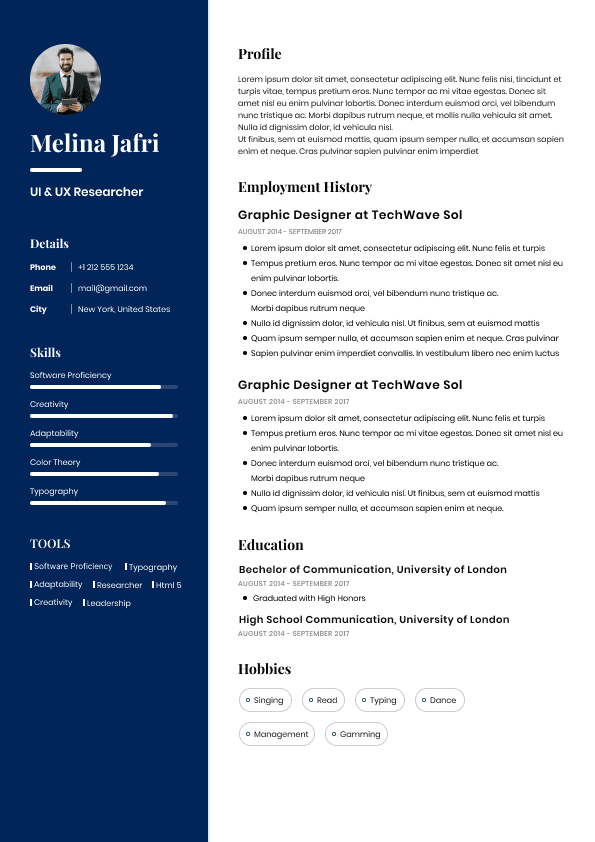
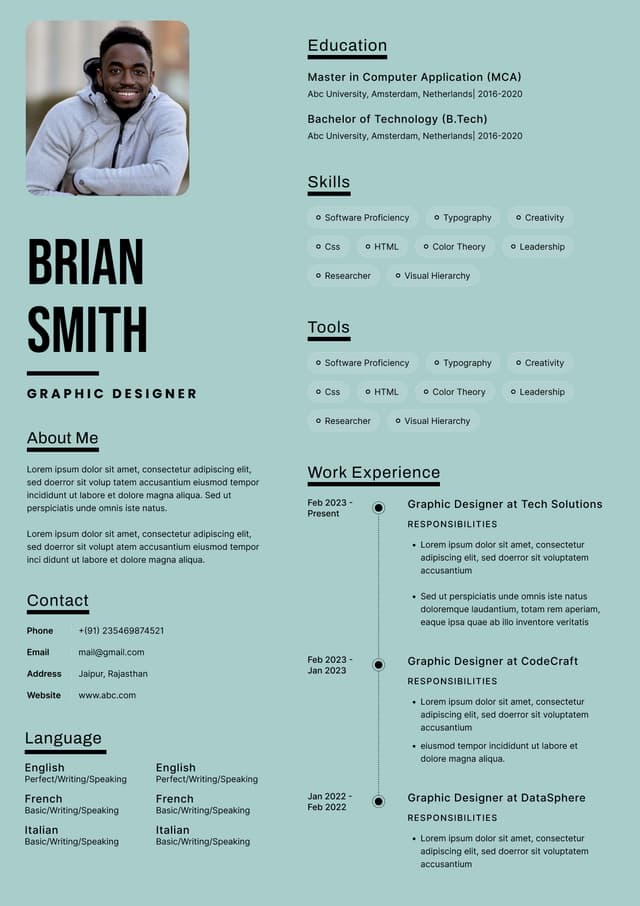
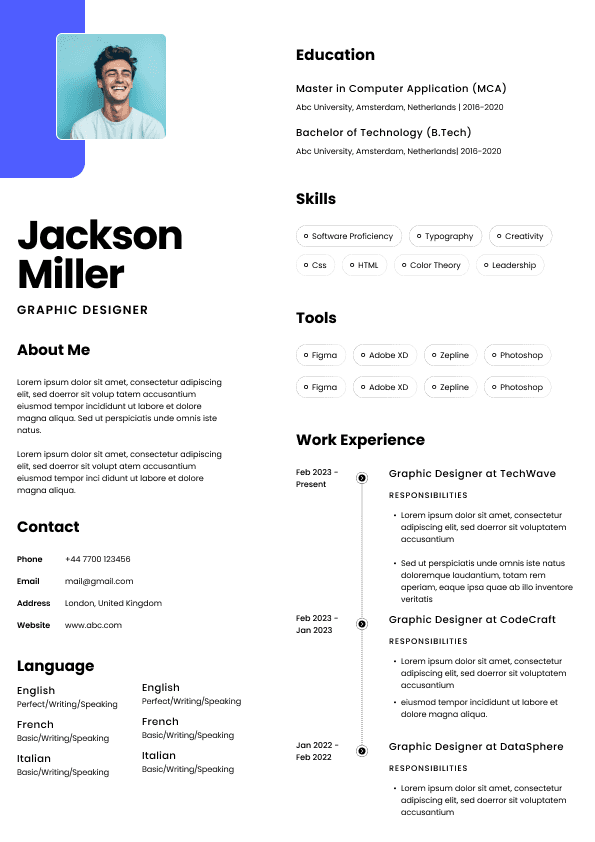
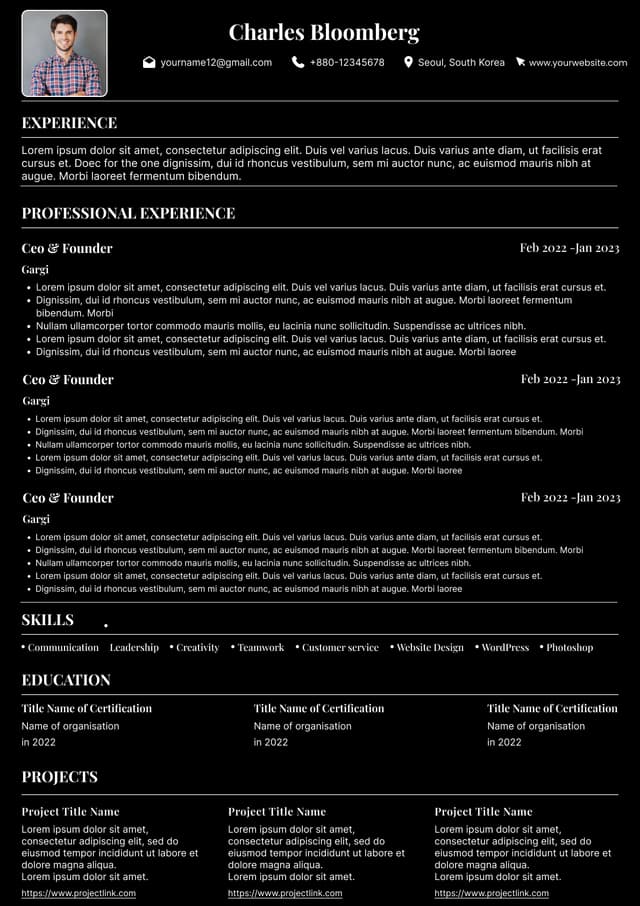
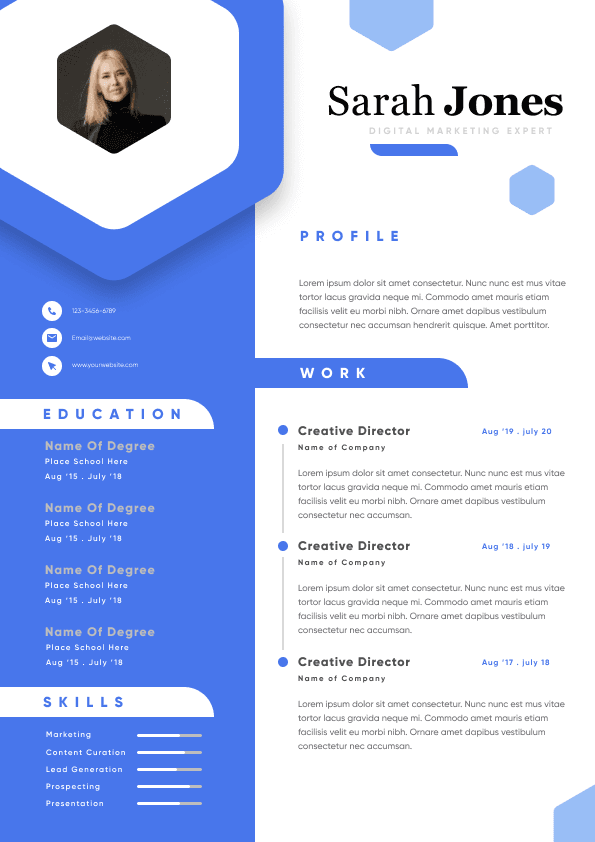
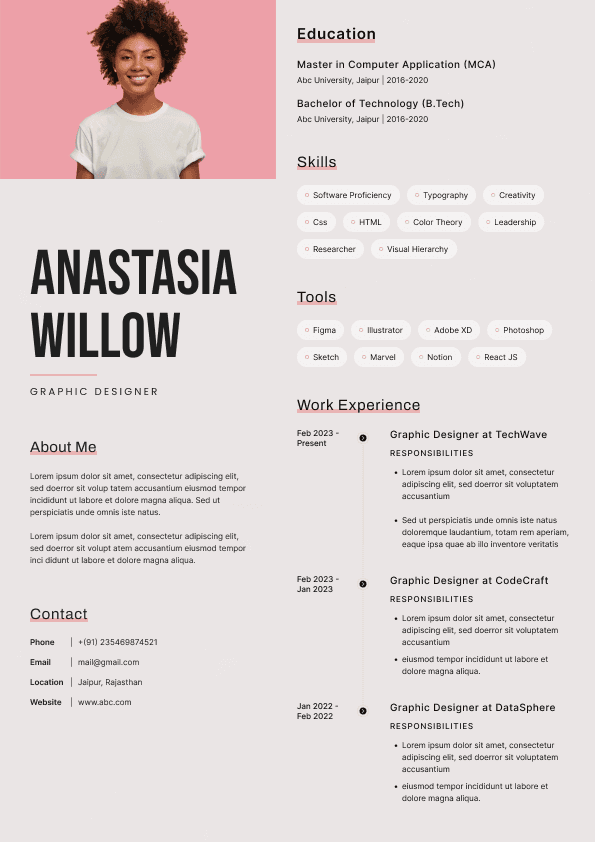
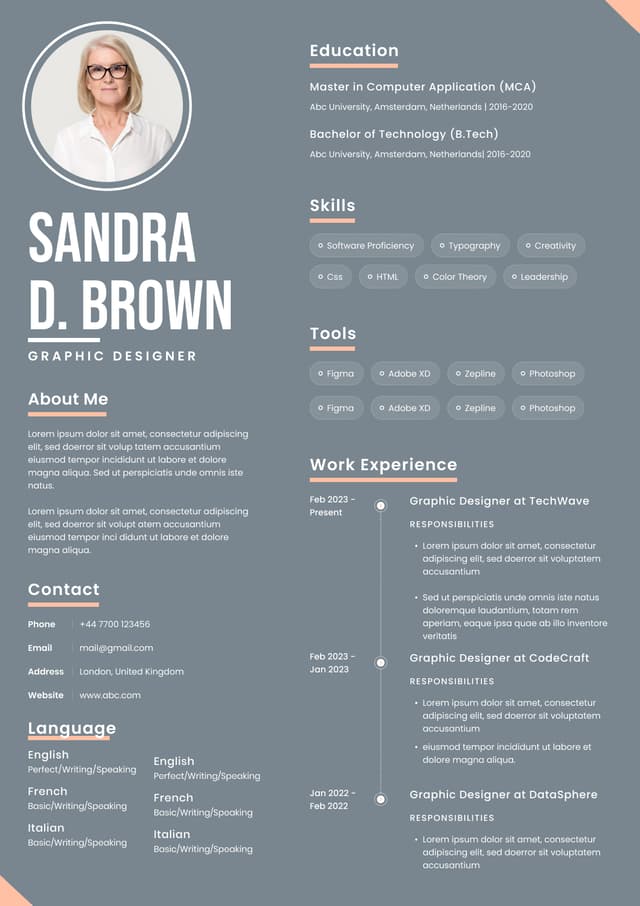
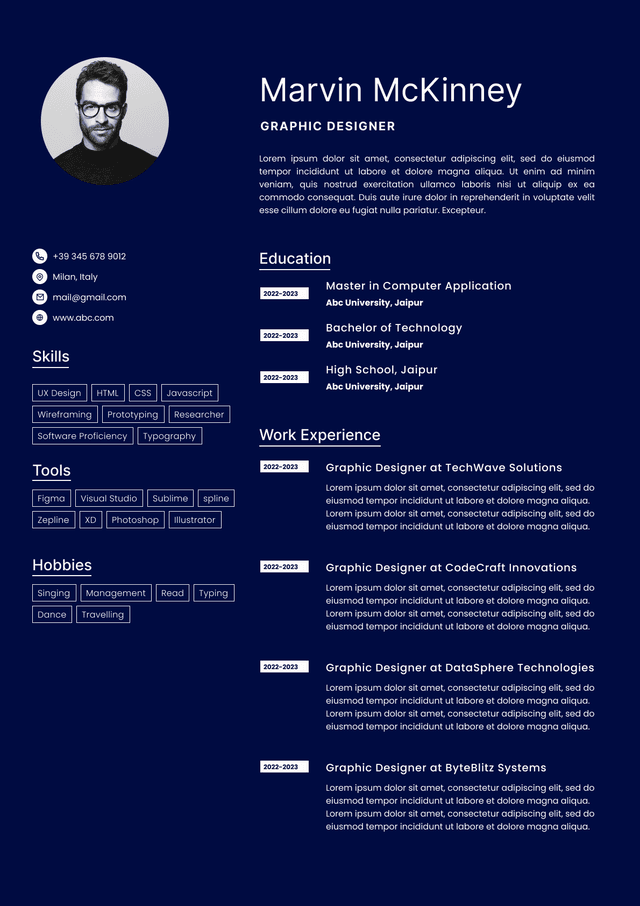
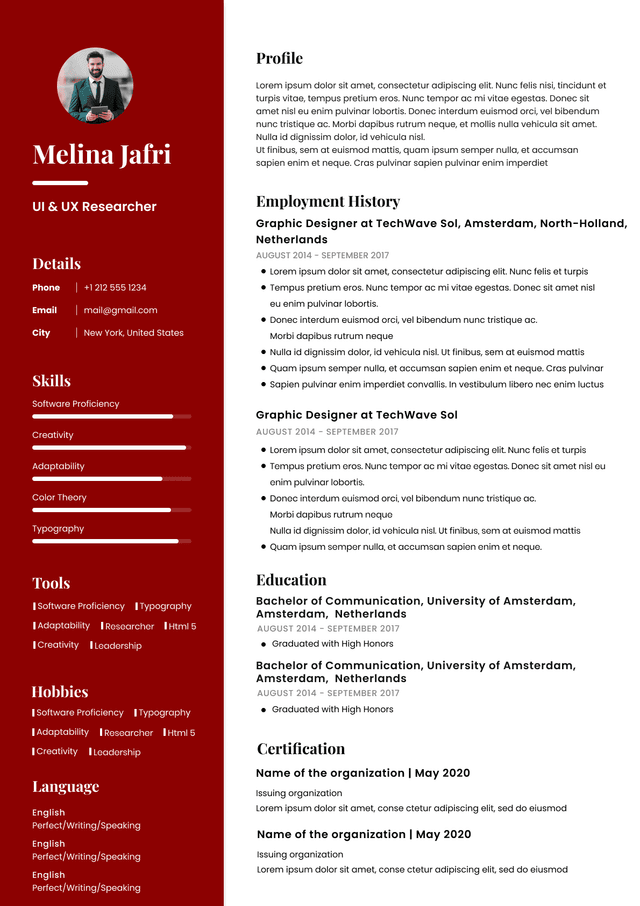
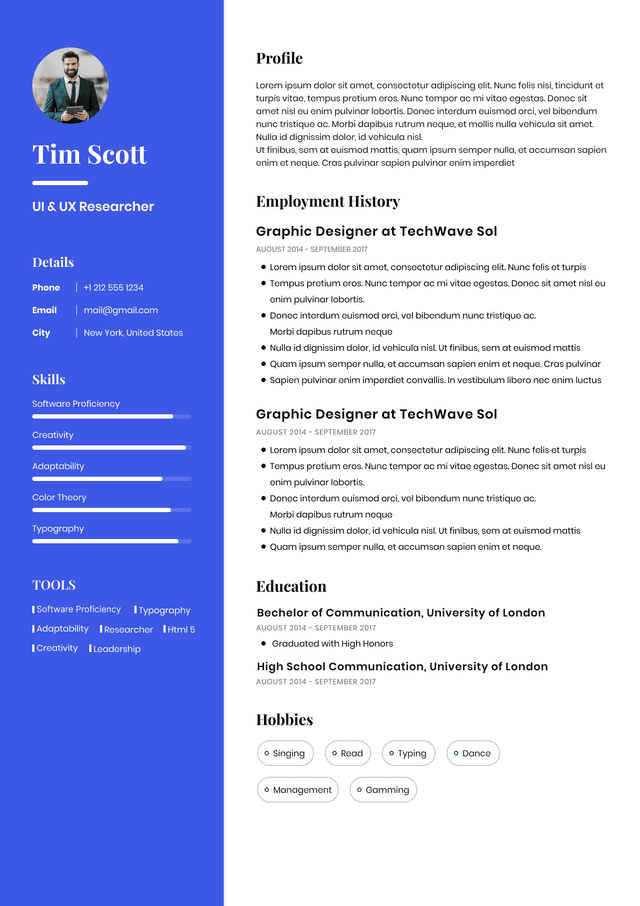
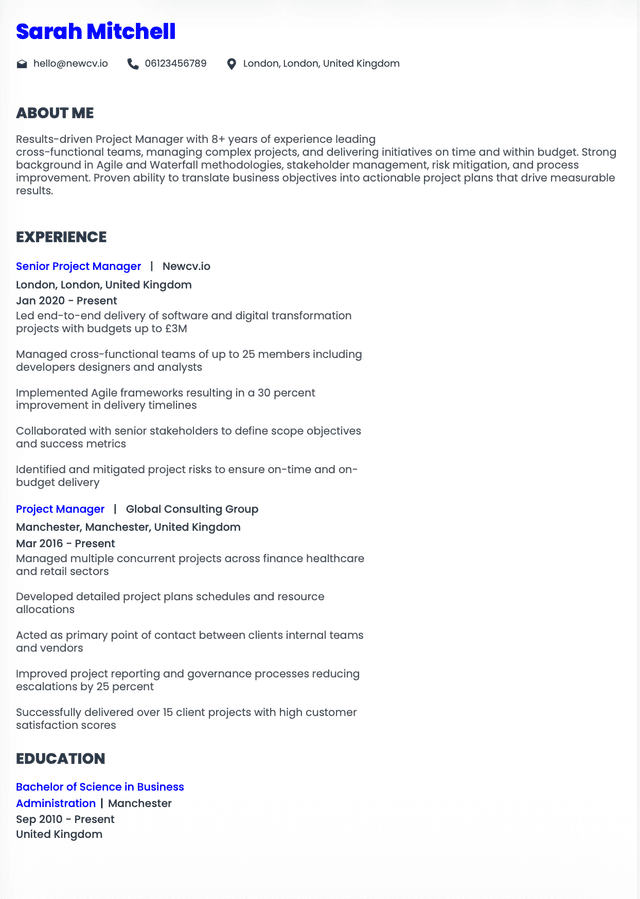
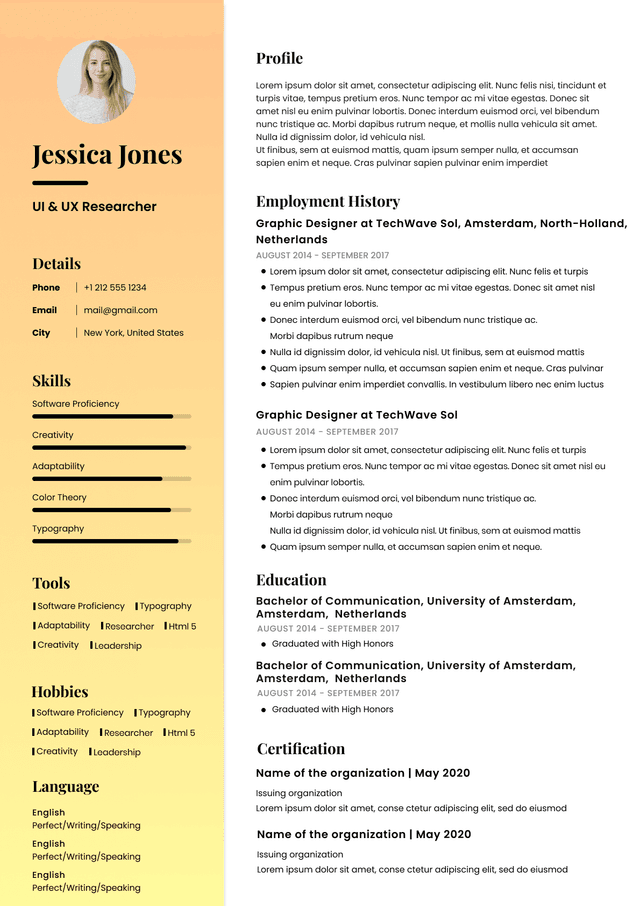
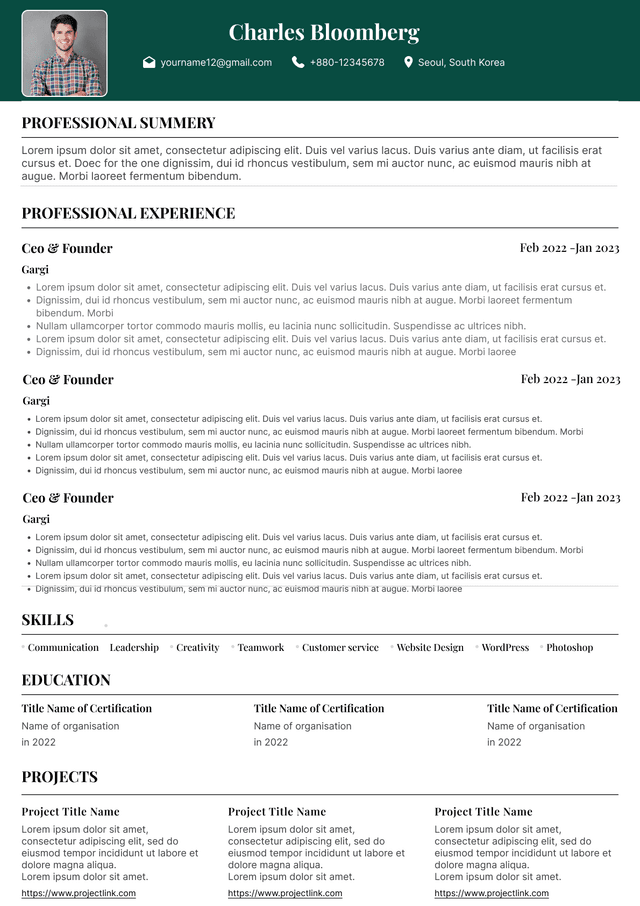
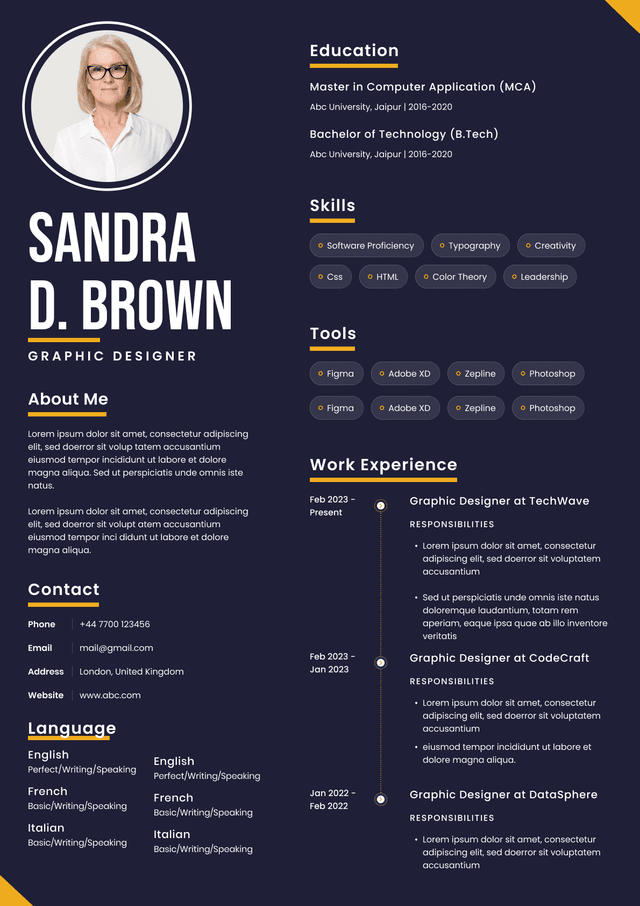
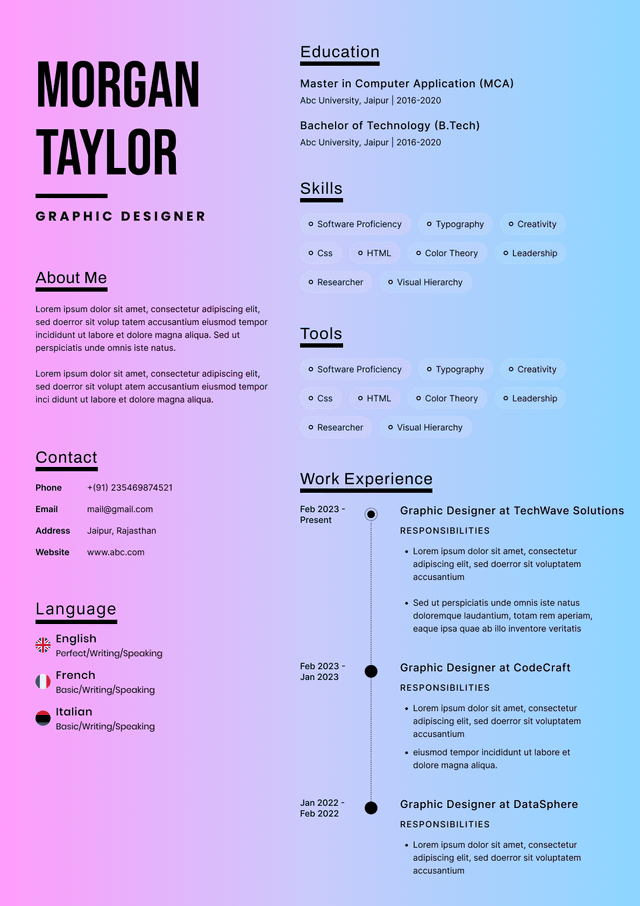
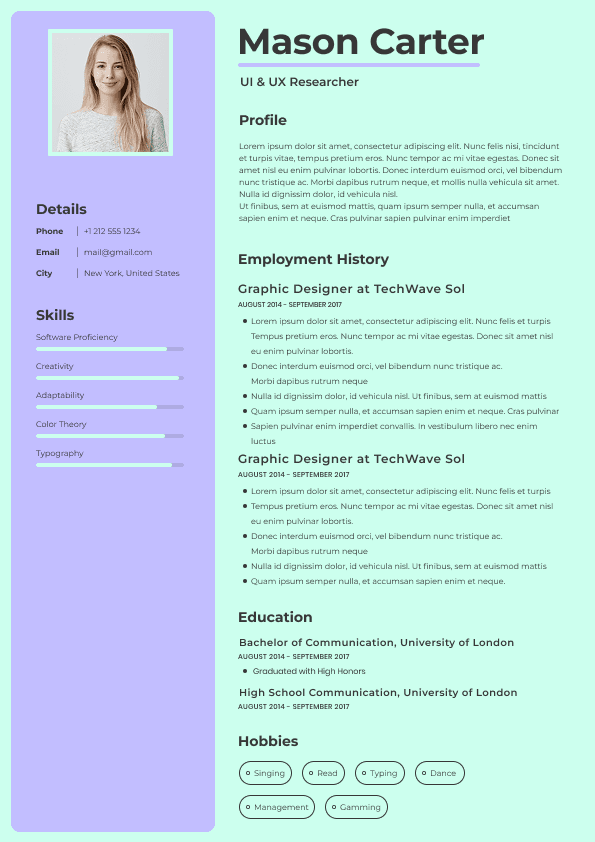
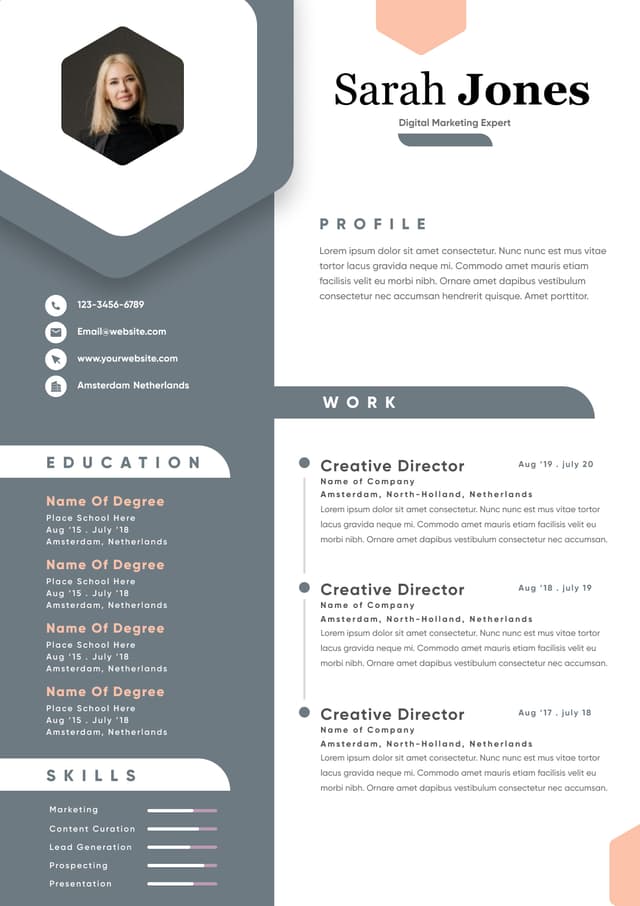
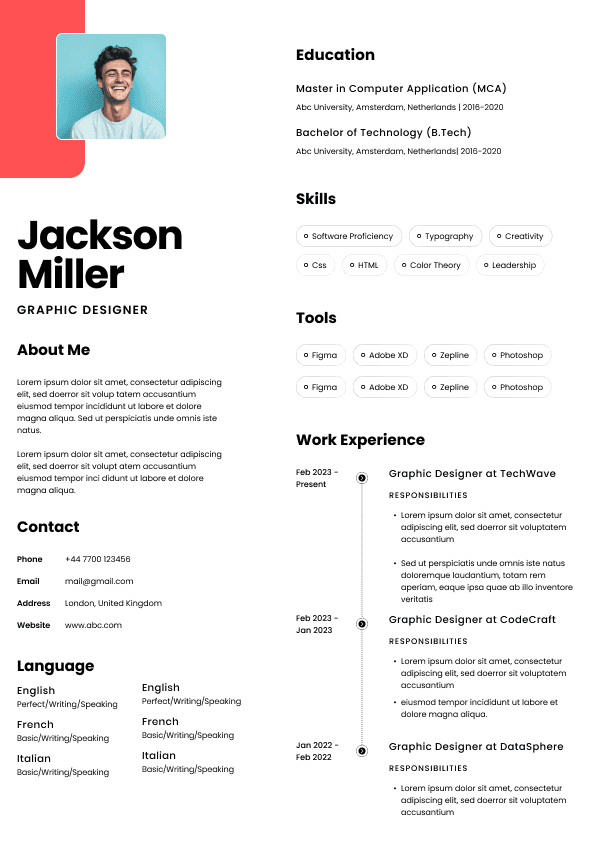
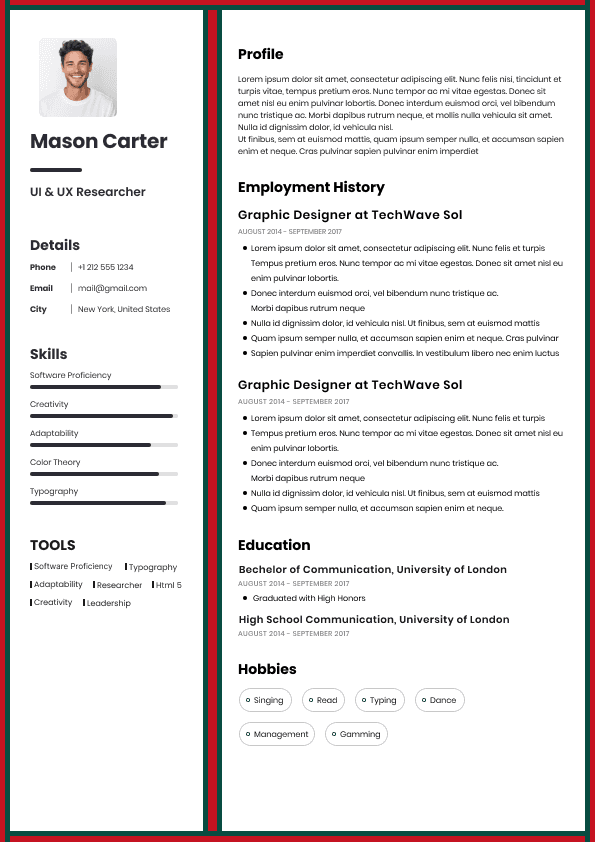
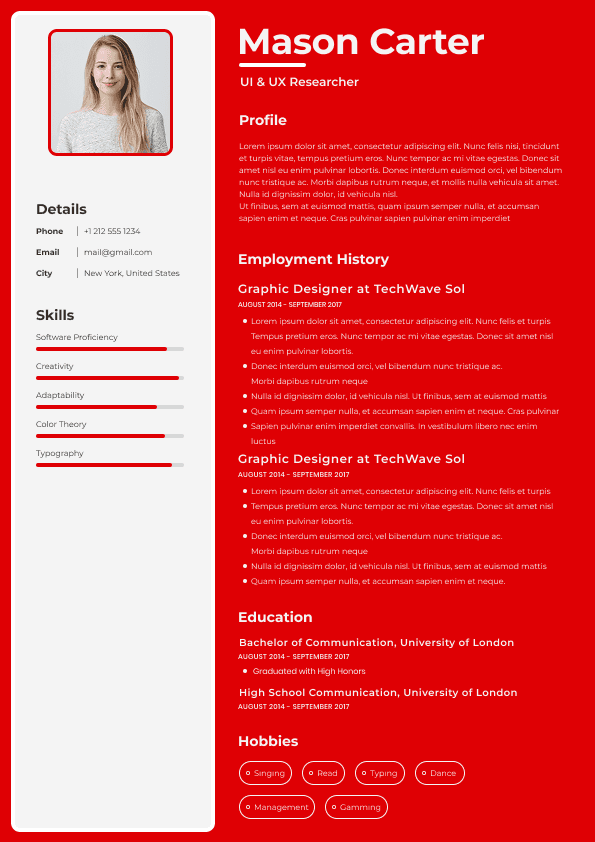
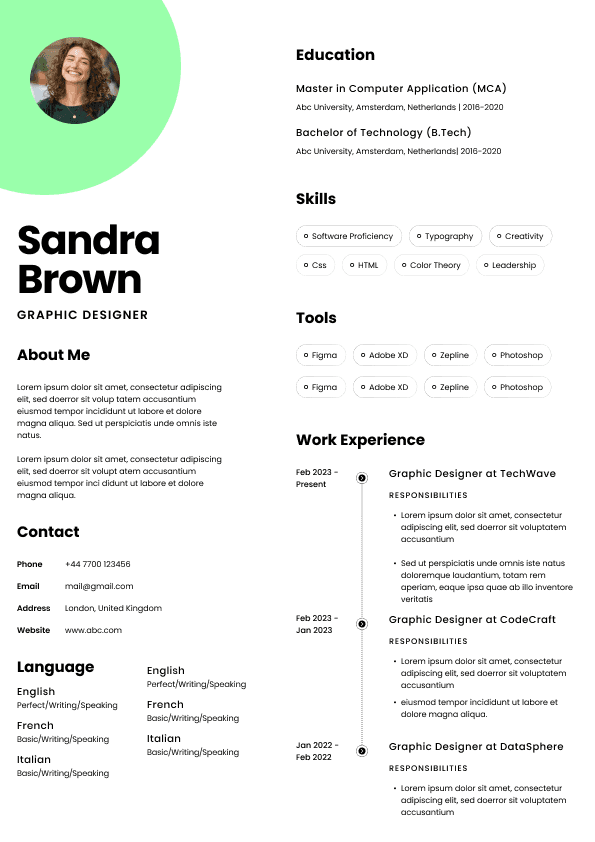
Choose from a wide range of NEWCV resume templates and customize your NEWCV design with a single click.

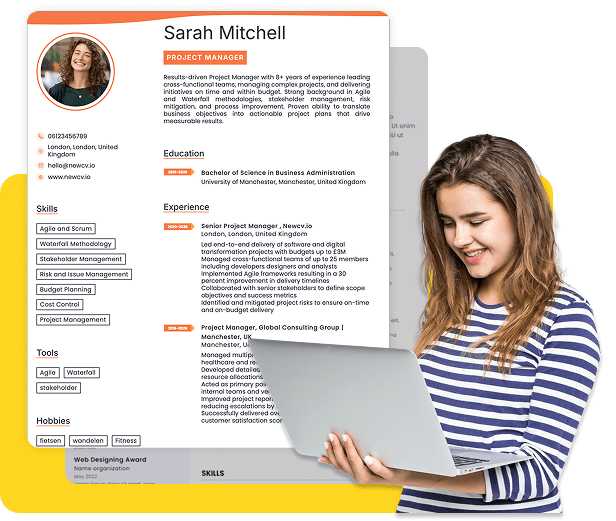
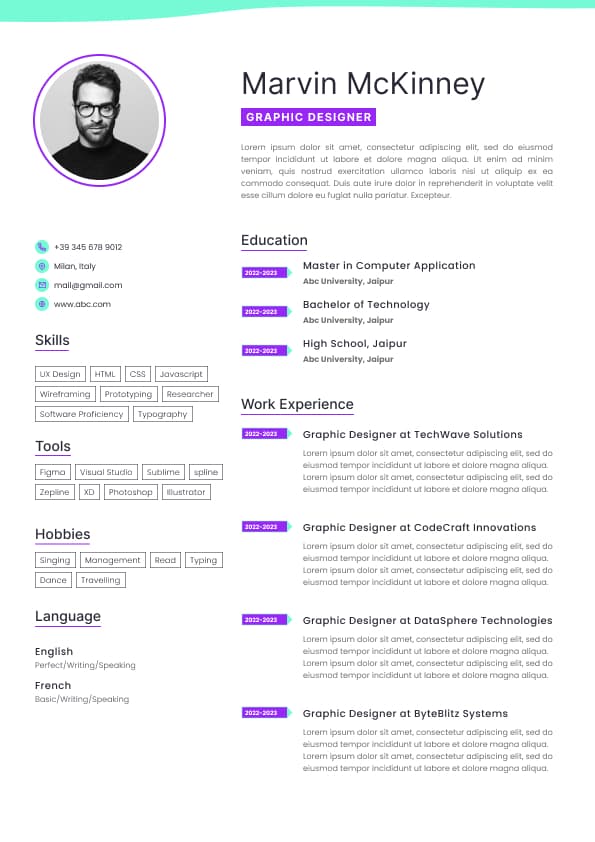
Use professional field-tested resume templates that follow the exact Resume rules employers look for.
Create ResumeA Data Analyst resume for freshers is not evaluated on tenure.
It is evaluated on analytical credibility.
Recruiters and ATS systems reviewing entry-level data analyst resumes are not asking:
“Does this candidate have corporate experience?”
They are asking:
•Can this candidate manipulate data independently?
• Can this candidate extract business insight from raw datasets?
• Is this candidate technically reliable?
• Does this resume prove analytical thinking — not just tool familiarity?
In modern hiring pipelines, freshers are compared against peers with internships, bootcamps, certifications, and personal analytics portfolios. The ranking logic is comparative.
This page explains how Data Analyst fresher resumes are actually screened — and what determines visibility.
In data roles, ATS matching prioritizes:
•SQL proficiency
• Python or R usage
• Excel depth beyond basics
• Data visualization tools
• Statistical methods
• Business problem framing language
If your resume lists:
“Excel, SQL, Python”
without context, the ATS sees low-density signal.
If your resume includes:
•Built SQL queries joining 6 relational tables
• Automated Python data cleaning pipeline
• Designed Power BI dashboards tracking 25 KPIs
the semantic match score increases significantly.
Tool mention alone is weak.
Tool application is strong.
When recruiters review fresher resumes, they look for three validation layers:
They scan project descriptions first.
Questions they subconsciously evaluate:
•Did this candidate write real queries?
• Did they handle messy datasets?
• Did they use joins, aggregations, window functions?
• Did they perform feature engineering?
Without evidence of execution, listing tools is meaningless.
Strong resumes demonstrate:
•Hypothesis formation
• Problem framing
• Metric selection
• Outcome interpretation
Weak resumes describe:
“Analyzed data and created reports.”
Strong resumes describe:
“Identified customer churn drivers by analyzing 50K transaction records, leading to 18% retention strategy insight.”
Recruiters prioritize candidates who connect data to decisions.
Statements like:
•Improved reporting accuracy by 32%
• Reduced manual reporting time by 6 hours per week
• Identified revenue leakage of $120K annually
signal business value — even in academic or personal projects.
Below is a competitive, ATS-aligned example for entry-level data analyst roles.
Data Analyst
Bachelor of Science in Statistics
Graduation: May 2026
Programming:
• Python (Pandas, NumPy, Matplotlib, Seaborn)
• SQL (MySQL, PostgreSQL)
Data Visualization:
• Power BI
• Tableau
Tools:
• Excel (Pivot Tables, Power Query, VLOOKUP, INDEX-MATCH)
• Jupyter Notebook
•Analyzed 48,000 customer records using Python and SQL
• Performed data cleaning and feature engineering reducing null values by 37%
• Built logistic regression model predicting churn with 84% accuracy
• Identified pricing sensitivity as primary churn driver
• Presented retention strategy reducing projected churn by 12%
•Designed interactive Power BI dashboard tracking 25 KPIs
• Integrated data from 4 relational tables using SQL joins
• Automated weekly reporting reducing manual reporting time by 5 hours
• Highlighted underperforming product segments improving regional targeting strategy
•Conducted time-series analysis on 10 years of stock data
• Applied moving average and regression modeling techniques
• Improved forecasting accuracy by 18% compared to baseline model
•Google Data Analytics Professional Certificate
• SQL Advanced Querying Certification
This resume succeeds because it:
•Demonstrates technical depth, not tool listing
• Quantifies dataset size
• Shows model accuracy metrics
• Connects analysis to business impact
• Uses ATS-friendly formatting
• Avoids vague language
It avoids:
•Generic objectives
• Soft skill overemphasis
• Listing every software tool without context
• Academic-only language
Listing 20+ tools suggests surface familiarity, not mastery.
SQL remains foundational. Absence of query-level detail reduces credibility.
Without dataset size, accuracy rate, or impact metrics, projects appear theoretical.
Complex layouts reduce parsing reliability and may lower ATS ranking.
Recent hiring shifts show:
•Increased competition from bootcamp graduates
• Portfolio and GitHub review becoming common
• AI-assisted ATS semantic scoring
• Strong preference for real-world dataset handling
Freshers are compared directly against candidates who have internship experience.
The differentiator is not degree title.
It is applied analytical signal density.
Use ATS-optimised Resume and resume templates that pass applicant tracking systems. Our Resume builder helps recruiters read, scan, and shortlist your Resume faster.

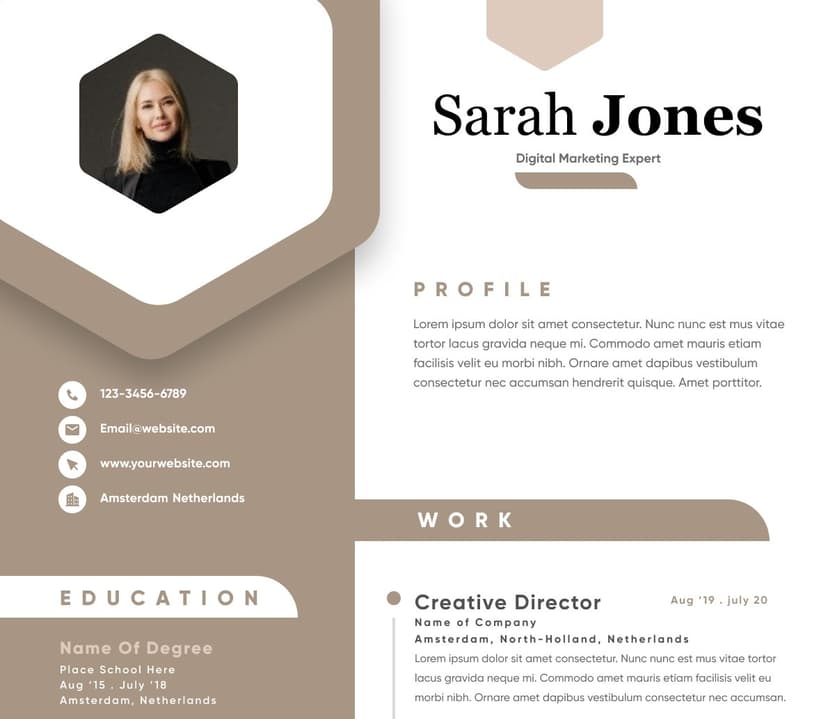
Use professional field-tested resume templates that follow the exact Resume rules employers look for.
Create Resume