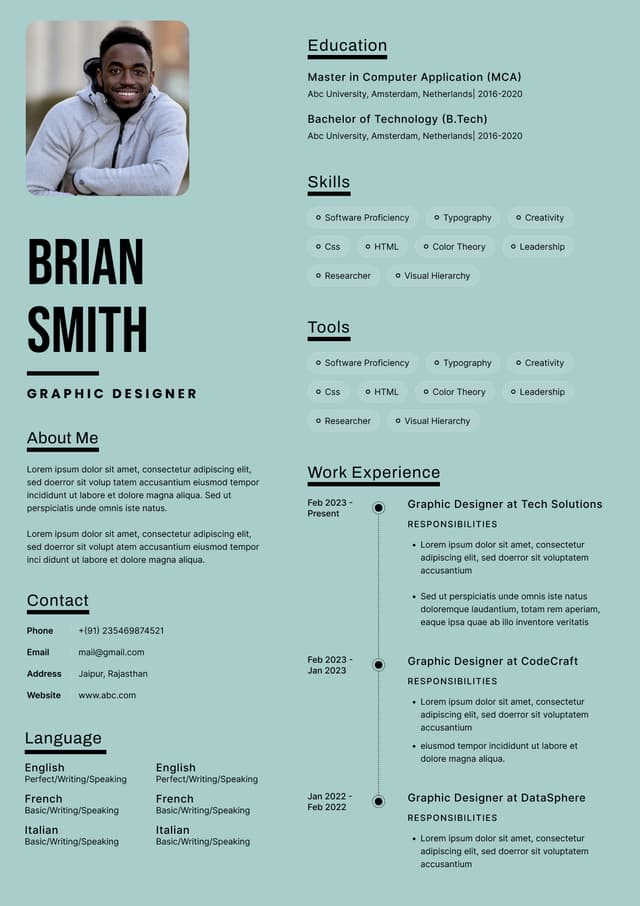
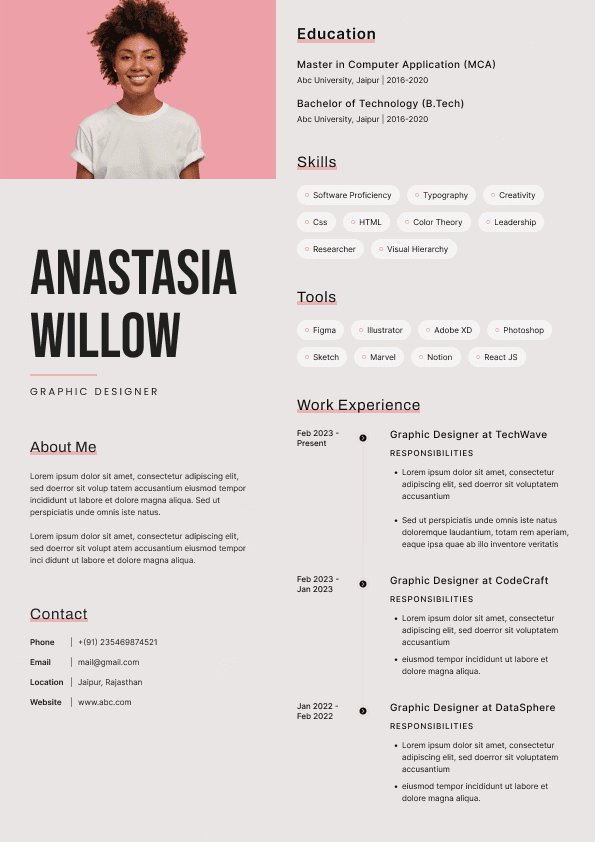
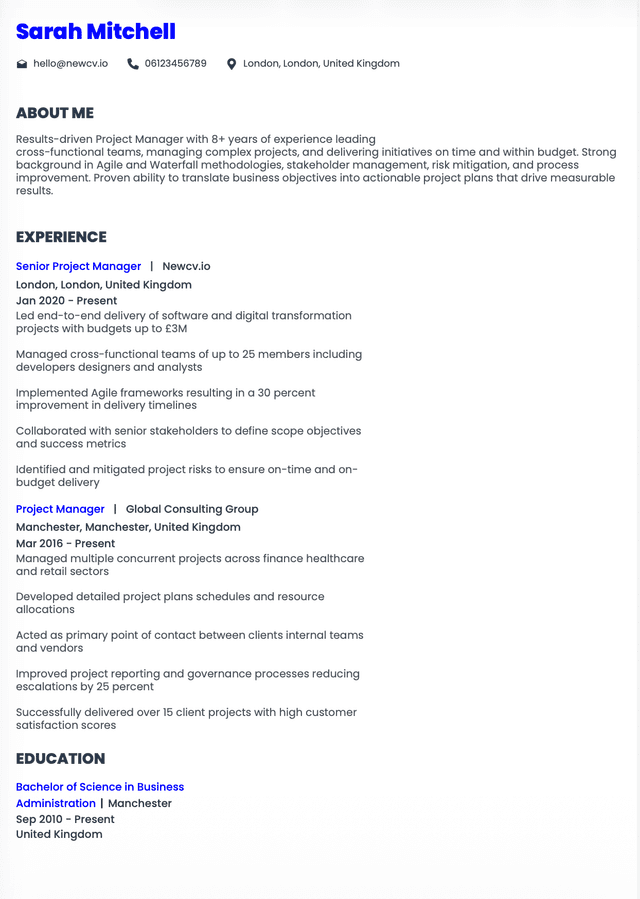
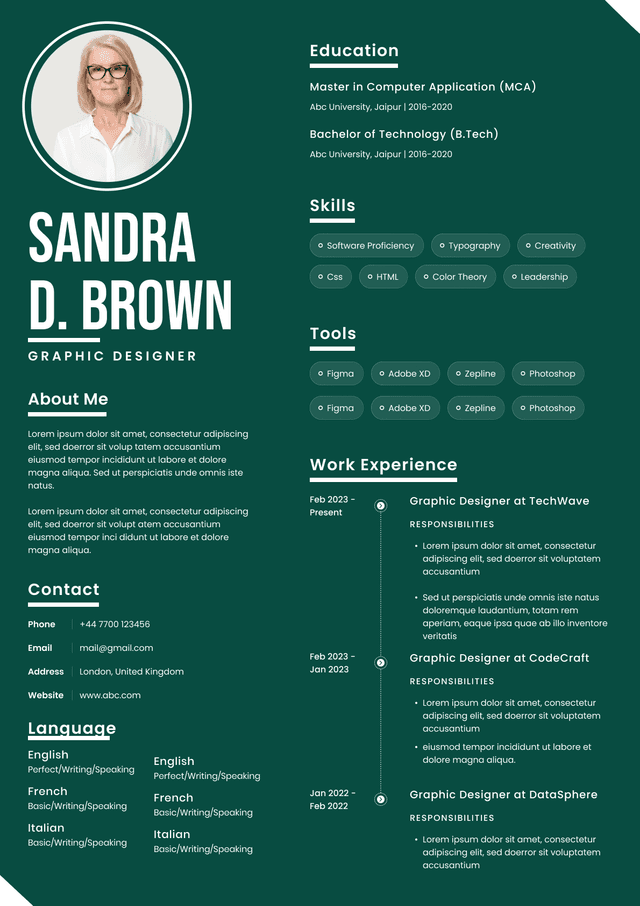
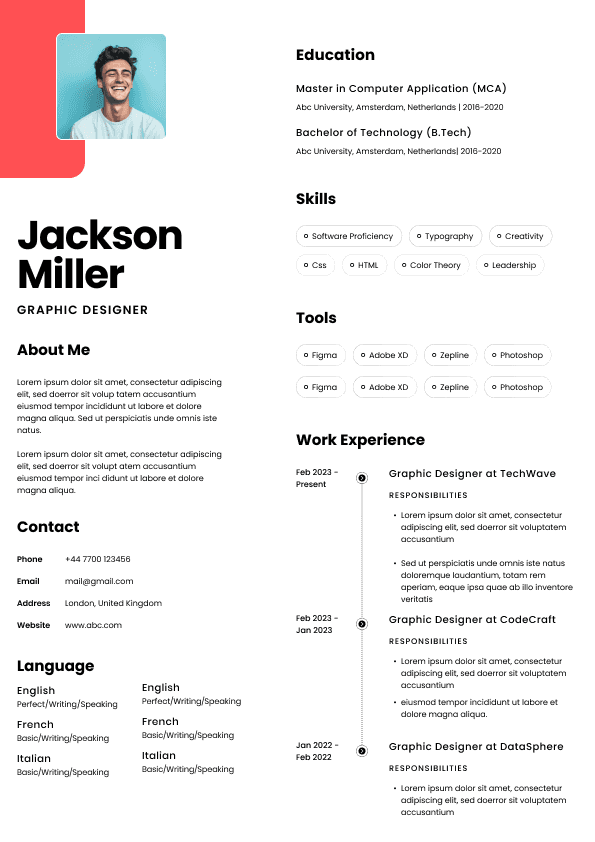
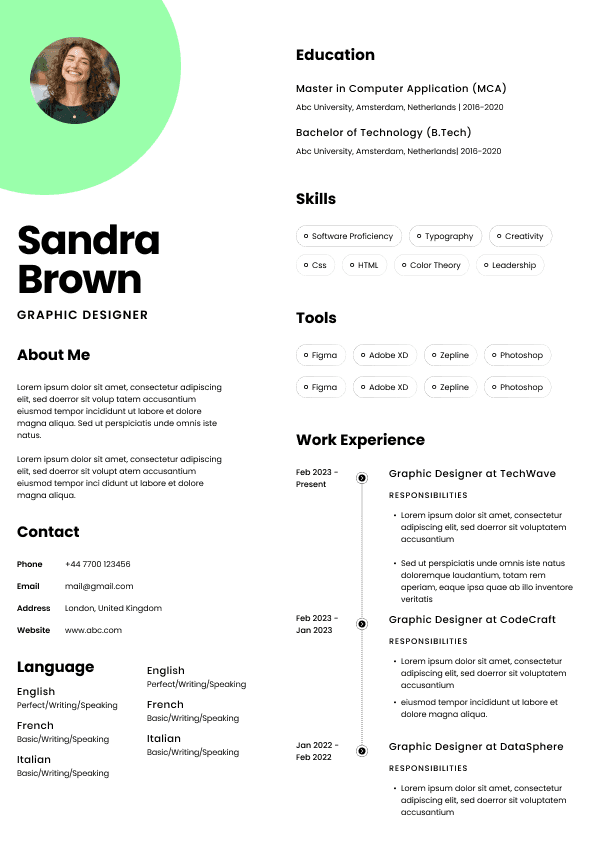
Choose from a wide range of NEWCV resume templates and customize your NEWCV design with a single click.
If you want your data analyst resume to stand out, you must show measurable impact using metrics, KPIs, and results. Hiring managers don’t just want to see what you did, they want proof of how well you did it. The strongest resumes quantify achievements using numbers like percentages, time saved, accuracy rates, and business outcomes. This guide gives you exact, real-world examples you can use and adapt immediately.
Recruiters scan resumes for one thing first: evidence of business impact.
A strong data analyst resume doesn’t say:
“Created dashboards and reports.”
It says:
“Built 25+ dashboards improving reporting efficiency by 30%.”
The difference is measurable value.
Productivity (volume of work completed)
Efficiency (time saved or process improvement)
Accuracy (data quality and reliability)
Business impact (revenue, conversion, decisions)
Stakeholder impact (adoption, satisfaction, usage)
If your resume lacks numbers, it looks like .
Action + Metric + Result + Context
Example:
“Automated SQL reporting pipelines, reducing manual reporting time by 35% across 5 departments.”
Shows technical skill (SQL automation)
Shows measurable improvement (35%)
Shows scale (5 departments)
Shows business relevance (time saved)
These examples are aligned with real hiring expectations across US companies.
These show how much work you handle and deliver.
Built and maintained 25+ dashboards or recurring reports while meeting stakeholder deadlines
Completed 50+ ad hoc analyses monthly with consistent on-time delivery
Delivered daily, weekly, and monthly reporting across 5+ business units
Managed high-volume reporting cycles supporting quarterly and executive reviews
If your role involves reporting volume, dashboards, or analysis frequency
These show how you improve workflows and reduce effort.
Reduced reporting time by 35% through SQL automation and dashboard redesign
Eliminated 12+ hours of manual spreadsheet work per week via process automation
Streamlined data workflows, reducing report turnaround time by 25%
Standardized templates, improving reporting speed across teams
Efficiency metrics are highly valued because they directly impact cost and scalability.
These prove trust in your data.
Maintained 99%+ data accuracy across recurring KPI reports
Achieved zero critical reporting errors during audit and quarter-end cycles
Reduced data discrepancies by 40% through validation processes
Ensured consistent metric definitions across teams to reduce reporting errors
Data analysts are trusted advisors. If accuracy is unclear, your credibility drops instantly.
These connect your work to real business outcomes.
Improved dashboard adoption by 20% through user-focused visualization design
Increased reporting efficiency leading to faster decision-making cycles
Supported business teams in improving conversion and retention metrics
Contributed to forecasting accuracy improvements across planning cycles
Even if you didn’t “own” the result, you can say:
“Supported improvements in…” or “Contributed to…”
These are your strongest resume bullets.
Analyzed 100K+ row datasets to identify trends and business opportunities
Delivered insights that supported successful product launches and planning cycles
Reduced reporting disputes by standardizing metric definitions across departments
Improved stakeholder satisfaction through faster insights and clearer reporting
“Responsible for creating reports and dashboards.”
“Built 25+ dashboards and reduced reporting time by 35% through automation and redesign.”
“Worked with large datasets.”
“Analyzed 100K+ row datasets to identify trends and improve business decision-making.”
Many candidates struggle here, but you can still quantify intelligently.
Frequency (daily, weekly, monthly tasks)
Volume (number of reports, dashboards, stakeholders)
Time (hours saved, turnaround time)
Scope (teams, departments, users)
Instead of:
“Created reports for different teams”
Say:
“Delivered weekly reporting for 5+ departments, supporting business decision-making”
This is the biggest mistake. It makes your work look generic.
“Used SQL, Excel, Power BI” is not enough.
Fix it:
“Used SQL and Power BI to reduce reporting time by 30%”
Focus on impact, not just tools
Avoid phrases like:
Helped with
Assisted in
Responsible for
Replace with:
These go beyond basic reporting and signal mid to senior-level capability.
Improved forecasting accuracy across business units
Reduced data inconsistencies through governance frameworks
Increased stakeholder adoption of dashboards and reporting tools
Built scalable reporting systems supporting growing data needs
Focus on:
Volume of work
Accuracy
Learning impact
Example:
“Maintained 98%+ accuracy across recurring reports and dashboards”
Focus on:
Efficiency improvements
Stakeholder impact
Process optimization
Example:
Metrics should appear in:
Every bullet should include measurable impact where possible.
Example:
“Data Analyst with 5+ years experience improving reporting efficiency by up to 35% and maintaining 99%+ data accuracy.”
From a hiring perspective, the resumes that move forward:
Show clear impact in the first 5 seconds
Use numbers in almost every bullet
Connect technical skills to business outcomes
Avoid generic responsibilities
If your resume reads like a job description, it will be skipped.
Make sure your resume:
Includes numbers in at least 70% of bullet points
Shows both efficiency and business impact
Mentions scale (teams, datasets, volume)
Uses strong action verbs
Avoids vague language

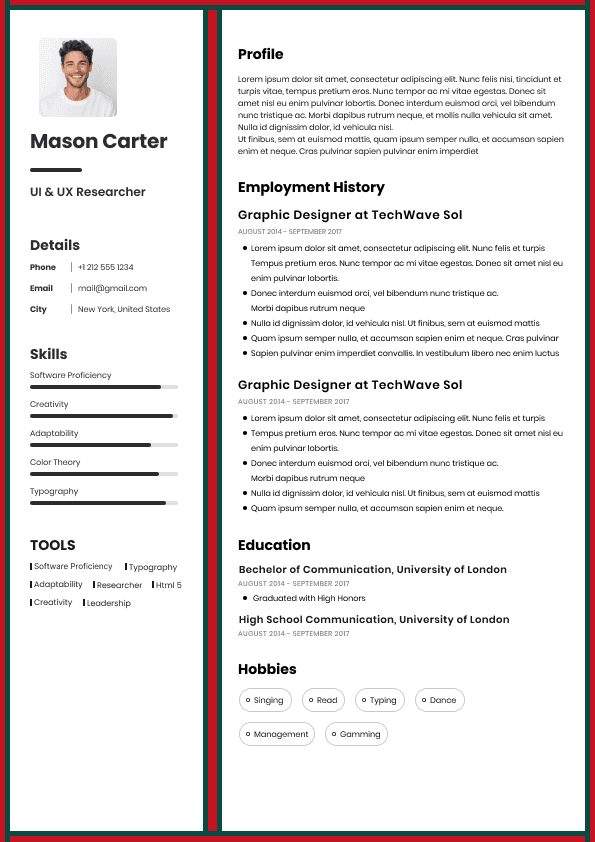
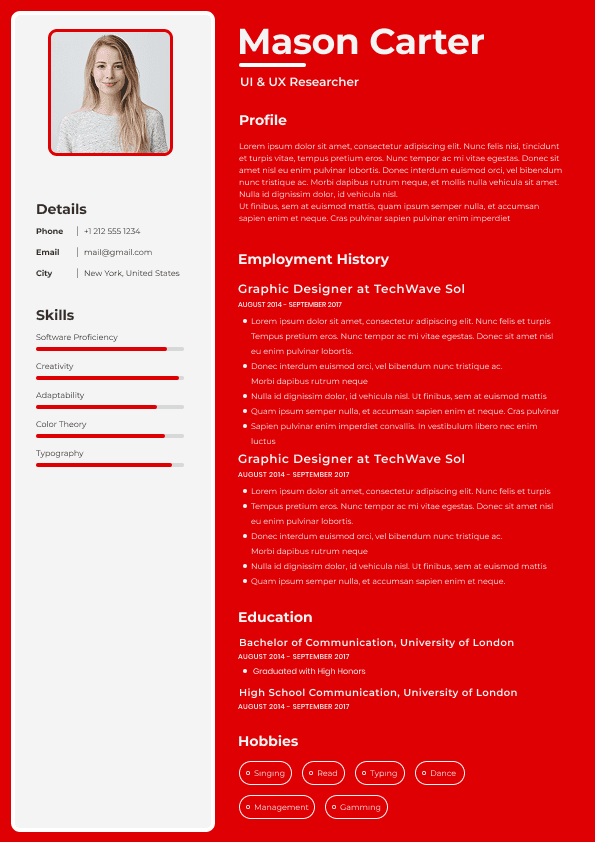
Use ATS-optimised Resume and resume templates that pass applicant tracking systems. Our Resume builder helps recruiters read, scan, and shortlist your Resume faster.

Use professional field-tested resume templates that follow the exact Resume rules employers look for.
Create Resume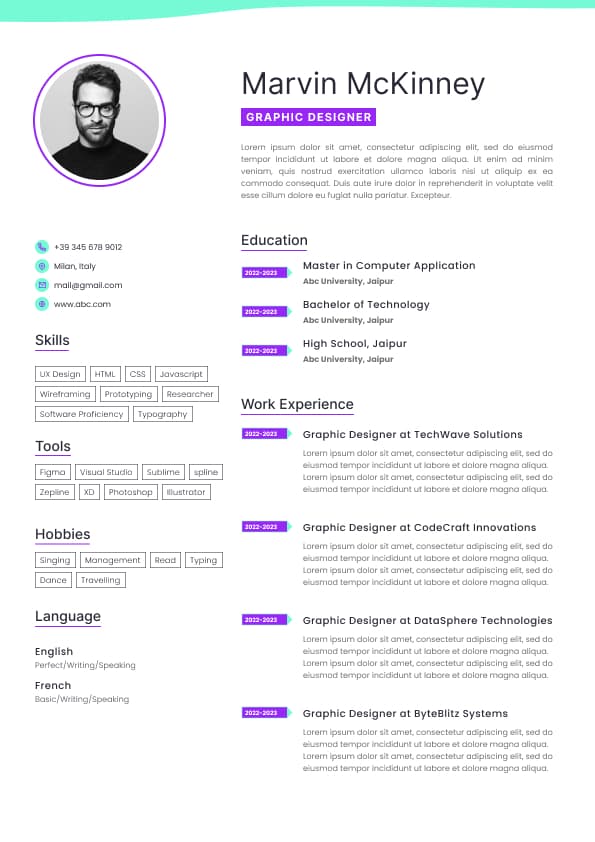
Use professional field-tested resume templates that follow the exact Resume rules employers look for.
Create ResumeReduced
Improved
Delivered
Increased
“Reduced reporting time by 35% through automation and improved workflows”
Focus on:
Business impact
Strategy
Cross-team influence
Example:
“Led reporting standardization across departments, reducing data discrepancies and improving decision-making”