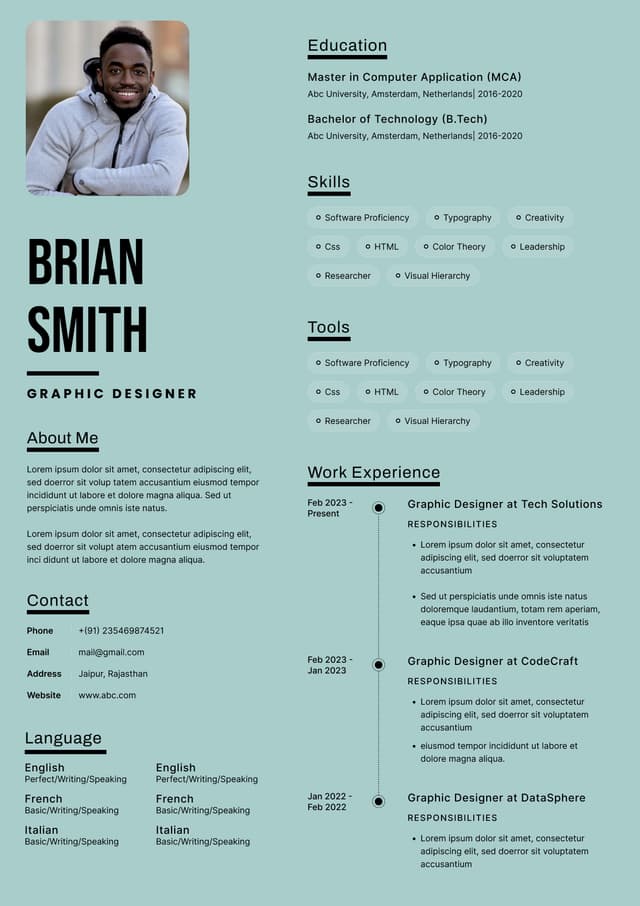
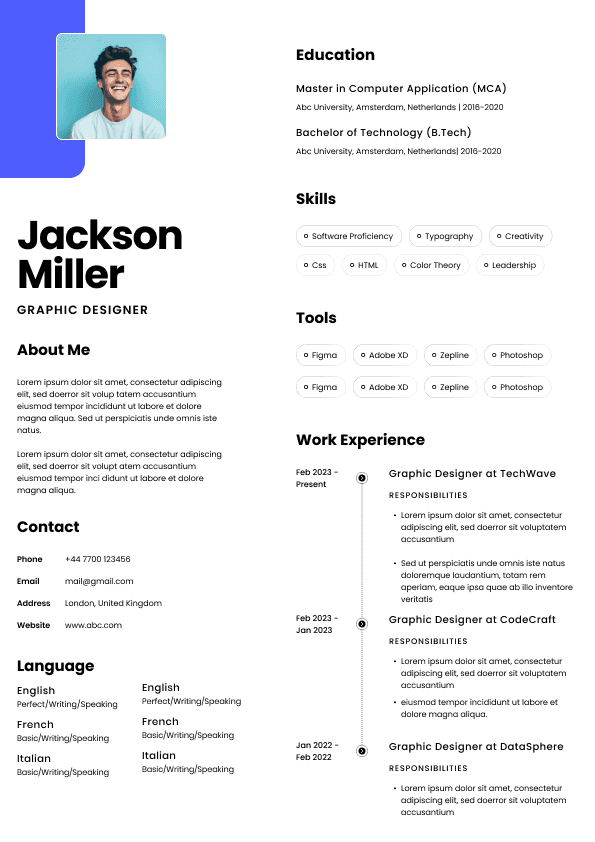
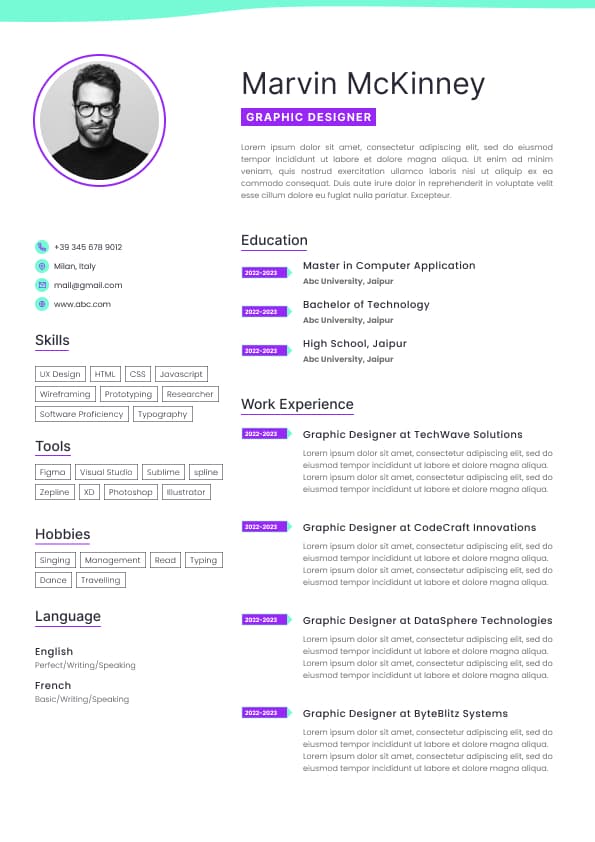
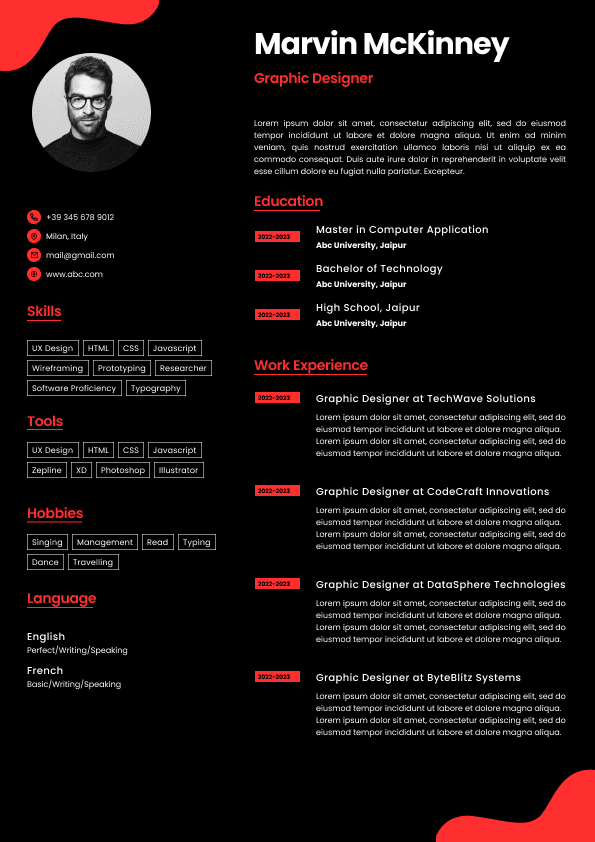
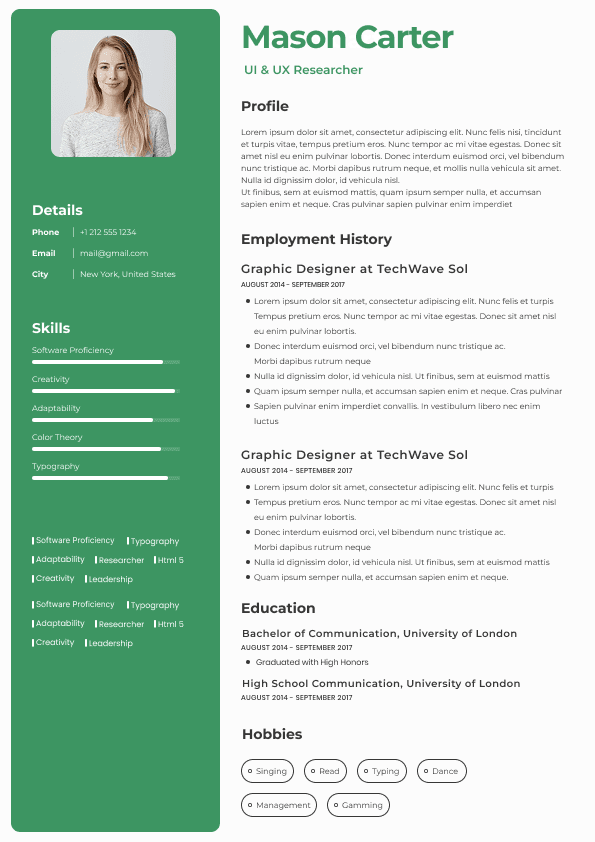
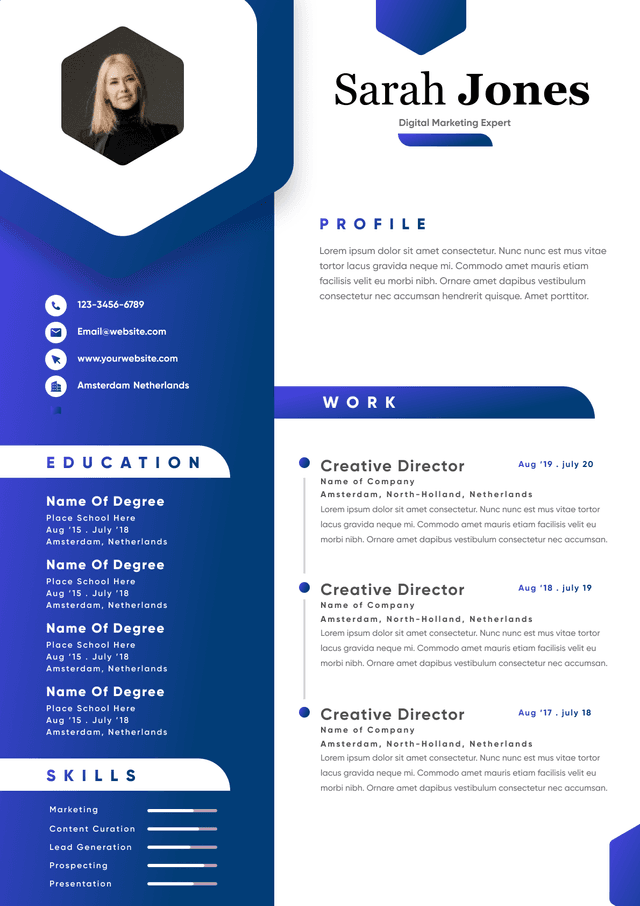
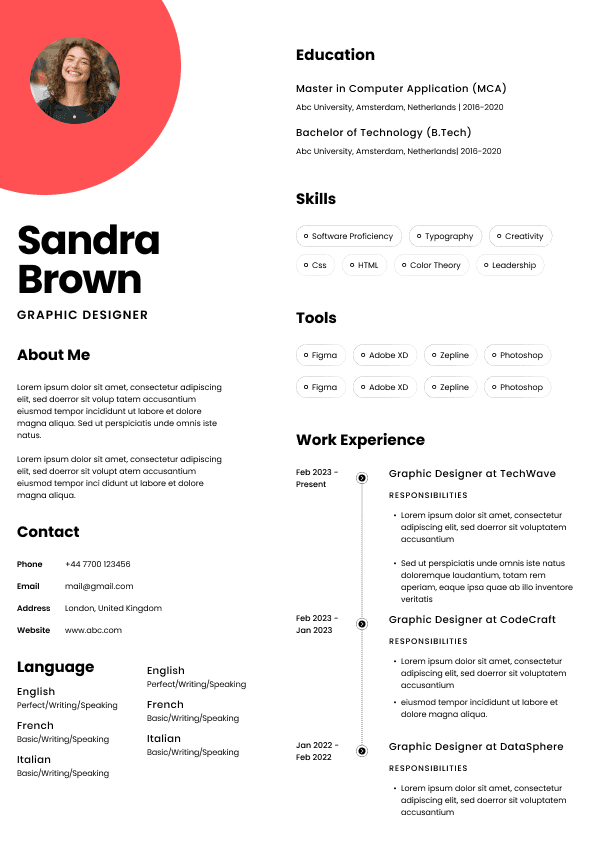
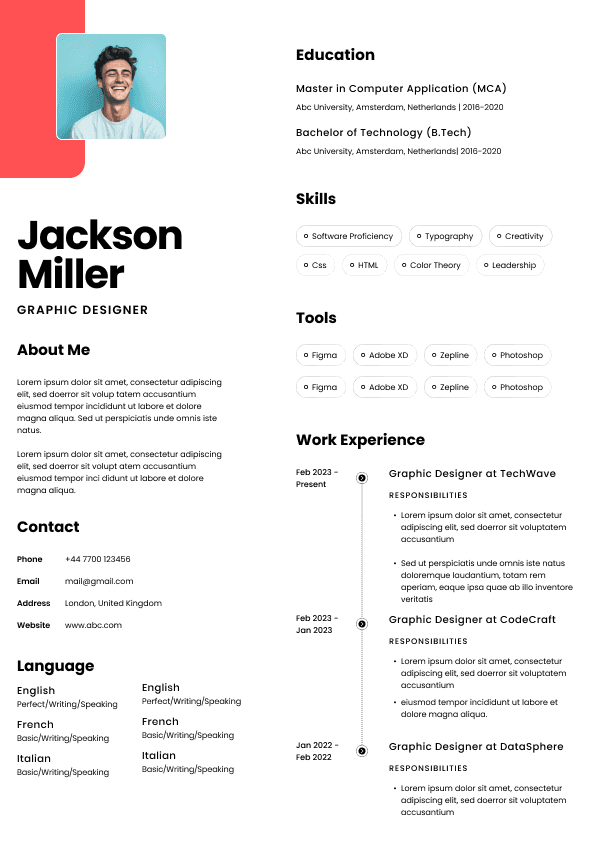
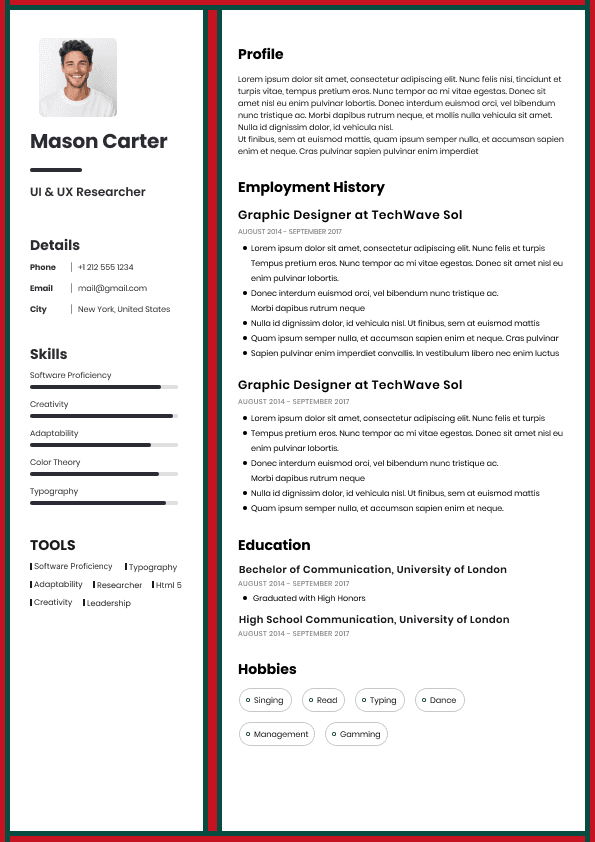
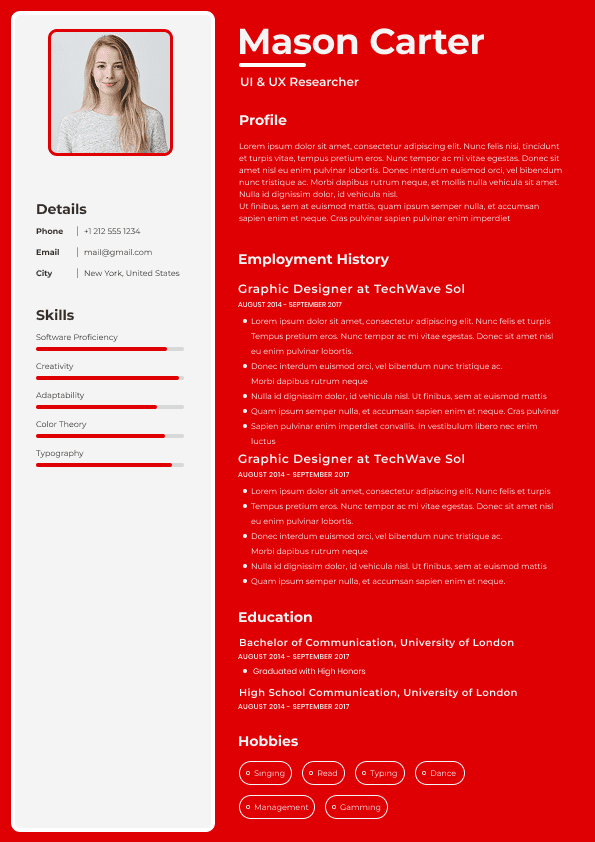
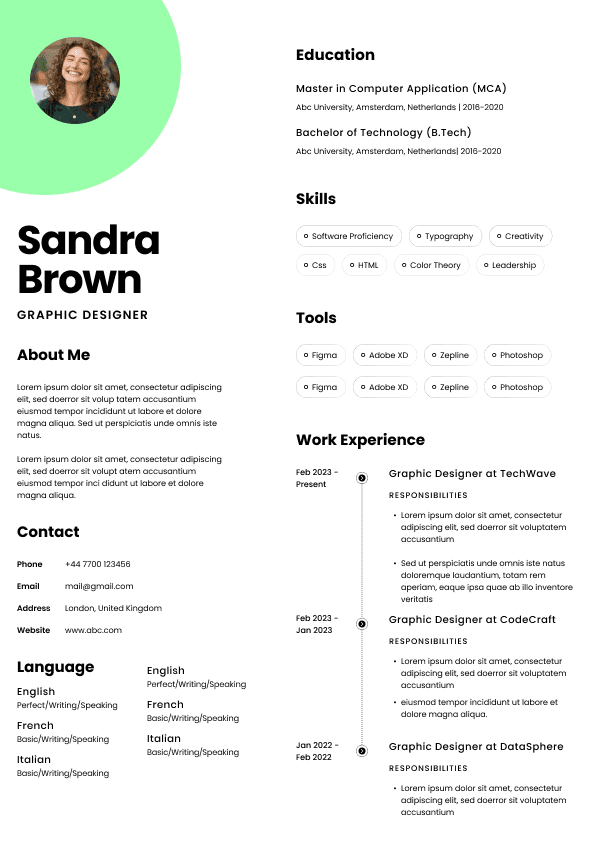
Choose from a wide range of NEWCV resume templates and customize your NEWCV design with a single click.

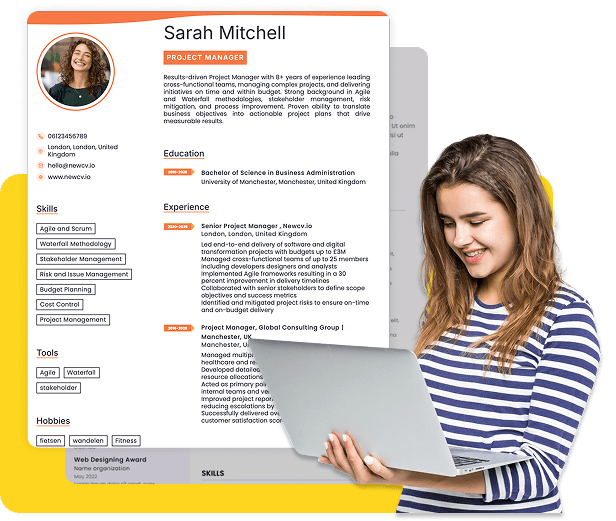

Use professional field-tested resume templates that follow the exact Resume rules employers look for.
Create ResumeIf you’re searching for “data researcher salary,” you’re not just looking for numbers. You’re trying to understand what you can realistically earn, how to increase it, and what separates a $60K candidate from a $180K one.
This guide breaks down how salaries are actually determined across ATS filters, recruiter screening, and hiring manager decision-making. It goes beyond averages and shows you how compensation works in real hiring scenarios.
A data researcher salary varies significantly depending on specialization, industry, and how your resume positions you.
Here’s the real-world breakdown based on US hiring data:
Entry-level (0–2 years): $55,000 – $80,000
Mid-level (3–5 years): $80,000 – $115,000
Senior (6–10 years): $115,000 – $160,000
Lead / Principal: $150,000 – $200,000+
However, these ranges are misleading if you don’t understand what actually drives where you land.
Two candidates with the same years of experience can differ by $40K–$70K based purely on positioning, impact metrics, and technical alignment.
Recruiters don’t assign salary based on effort or job titles. They benchmark based on perceived business impact and replaceability.
Here’s what they’re scanning in 6–10 seconds:
Can this person generate insights that influence decisions?
Do they work with real datasets or just academic projects?
Are they aligned with business outcomes or just analysis?
Are their tools modern and relevant?
If your resume reads like “collected data and created reports,” you’re automatically placed in the lower salary band.
If it reads like “drove strategic insights that impacted revenue, growth, or efficiency,” you’re positioned for higher compensation.
The title “data researcher” is broad. Your salary depends heavily on specialization.
Typical range: $65,000 – $110,000
Focus: Consumer insights, surveys, behavioral trends
Lower ceiling due to less technical complexity
Typical range: $75,000 – $130,000
Focus: SQL, dashboards, business reporting
Higher demand and better salary growth
Typical range: $110,000 – $180,000
Focus: predictive modeling, experimentation
Strong technical leverage increases pay
Typical range: $55,000 – $95,000
Lower pay due to non-commercial impact
Most online guides miss this completely. Salary is not driven by skills alone. It’s driven by signal strength.
Hiring managers pay more for outcomes, not activity.
Weak positioning:
“Analyzed survey data for customer insights.”
Strong positioning:
“Increased customer retention by 18% through segmentation analysis across 1.2M data points.”
Working with large datasets signals higher capability.
Small datasets: low impact perception
Large datasets: higher salary justification
Modern stack increases salary ceiling:
SQL
Python
R
Tableau / Power BI
Snowflake / BigQuery
Outdated tools reduce your perceived market value instantly.
Some industries pay significantly more:
Tech (highest salaries)
Finance / FinTech
Healthcare analytics
E-commerce
Lower-paying sectors:
Nonprofits
Academia
Government
Even in 2026, location still impacts salary, but less than before.
San Francisco: $120K – $180K
New York: $110K – $170K
Seattle: $110K – $165K
Austin: $95K – $140K
Chicago: $90K – $135K
Range: $85K – $160K
Top companies still benchmark against high-cost markets
Important insight:
Remote doesn’t guarantee high pay. Companies adjust based on competition, not fairness.
Entry-level candidates often overestimate salary potential.
Here’s what actually happens:
Strong internship + SQL + real projects → $70K–$85K
No real-world experience → $55K–$65K
Bootcamp-only candidates → often rejected or underpaid
Recruiter insight:
If your resume lacks real data ownership, you are seen as “trainable,” not “valuable.”
To break into top salary bands, you need to demonstrate ownership and influence.
Hiring managers look for:
Decision-making impact
Cross-functional collaboration
Stakeholder communication
Data storytelling at executive level
Weak senior candidate:
“Created dashboards for business teams.”
Strong senior candidate:
“Led cross-functional data strategy improving operational efficiency by 22% across 3 departments.”
Your resume must pass ATS before a recruiter even sees it.
Critical keywords for data researcher roles:
Data analysis
SQL
Python
Statistical modeling
Data visualization
Predictive analytics
A/B testing
Data pipelines
But here’s the key:
ATS alone doesn’t get you hired. It just gets you seen.
Your bullet points must convert attention into credibility.
Use this framework to elevate your salary band:
Action + Data + Outcome
Weak Example
“Analyzed customer data.”
Good Example
“Analyzed 2.5M customer records to identify churn patterns, reducing attrition by 15%.”
You look junior even if you’re experienced.
No proof = no leverage.
Hiring managers want business relevance, not theory.
Listing tools without context signals low depth.
Salary is often decided before interviews.
Here’s the internal process:
Resume reviewed → assigned level (junior, mid, senior)
Level determines salary band
Interview confirms or adjusts
Important:
You are not negotiating from zero. You are negotiating within a predefined band.
Anchor high within band
Use competing offers
Reference market benchmarks
Emphasize business impact
Asking without justification
Saying “I feel I deserve more”
Not understanding your level
Typical trajectory:
Year 0–2: Learning phase
Year 3–5: Specialization phase
Year 6–10: Leadership / ownership phase
Big salary jumps happen when:
You switch companies
You move into higher-impact roles
You reposition your experience
Top 10% candidates do this differently:
They quantify everything
They align work with revenue or growth
They specialize in high-value niches
They communicate insights clearly
They don’t just analyze data. They influence decisions.
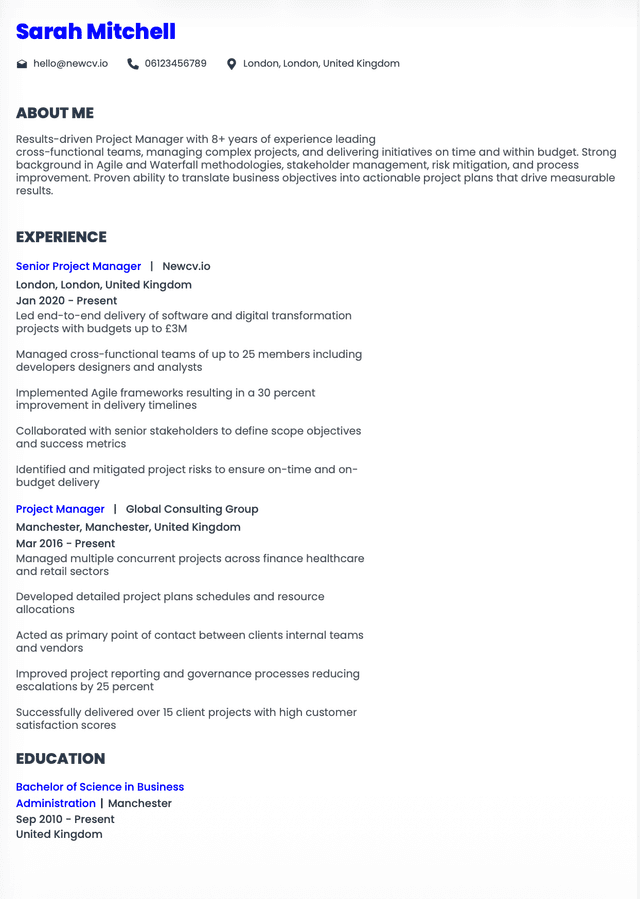
Candidate Name: Daniel Carter
Target Role: Senior Data Researcher
Location: New York, NY
PROFESSIONAL SUMMARY
Data Researcher with 8+ years of experience transforming large-scale datasets into actionable business insights. Proven track record of driving revenue growth, optimizing operations, and influencing executive decision-making through advanced analytics.
CORE SKILLS
SQL
Python
Data Visualization
Statistical Analysis
A/B Testing
Machine Learning
Data Storytelling
PROFESSIONAL EXPERIENCE
Senior Data Researcher – TechCorp Inc. (2021–Present)
Led analysis of 5M+ user data points, increasing customer retention by 21%
Developed predictive models improving forecasting accuracy by 30%
Partnered with product and marketing teams to optimize conversion funnels
Data Researcher – Insight Analytics (2018–2021)
Conducted segmentation analysis improving campaign ROI by 25%
Built dashboards used by senior leadership for strategic decisions
Automated reporting processes reducing manual work by 40%
Junior Data Analyst – DataWorks (2016–2018)
Cleaned and processed datasets for internal analytics projects
Assisted in building data pipelines and reporting systems
EDUCATION
Bachelor’s Degree in Data Science
TOOLS & TECHNOLOGIES
SQL
Python
Tableau
Power BI
Snowflake
It’s not your degree.
It’s not your years of experience.
It’s how clearly your work translates into business value.
Candidates who understand this consistently outperform others in both interviews and compensation.
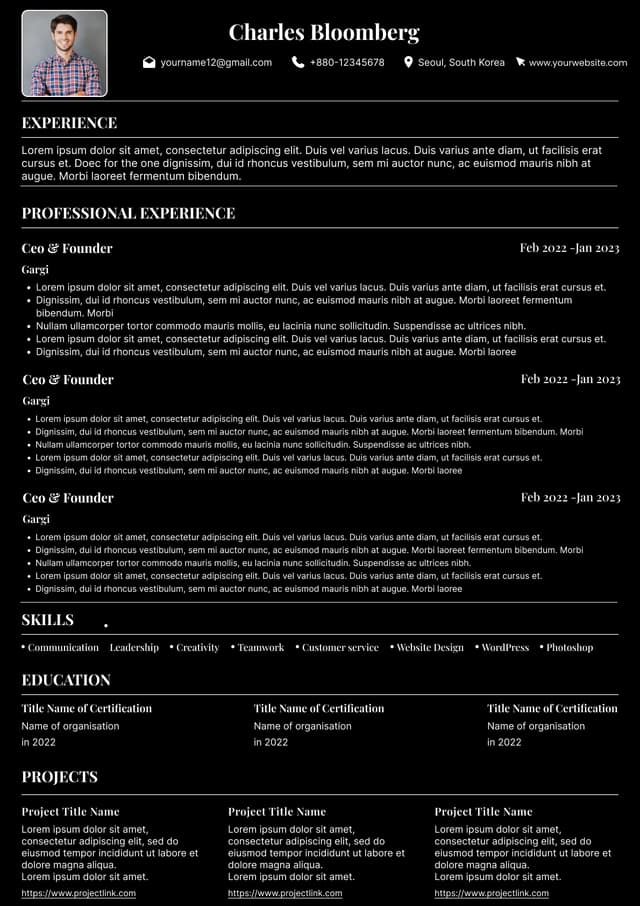
Use ATS-optimised Resume and resume templates that pass applicant tracking systems. Our Resume builder helps recruiters read, scan, and shortlist your Resume faster.

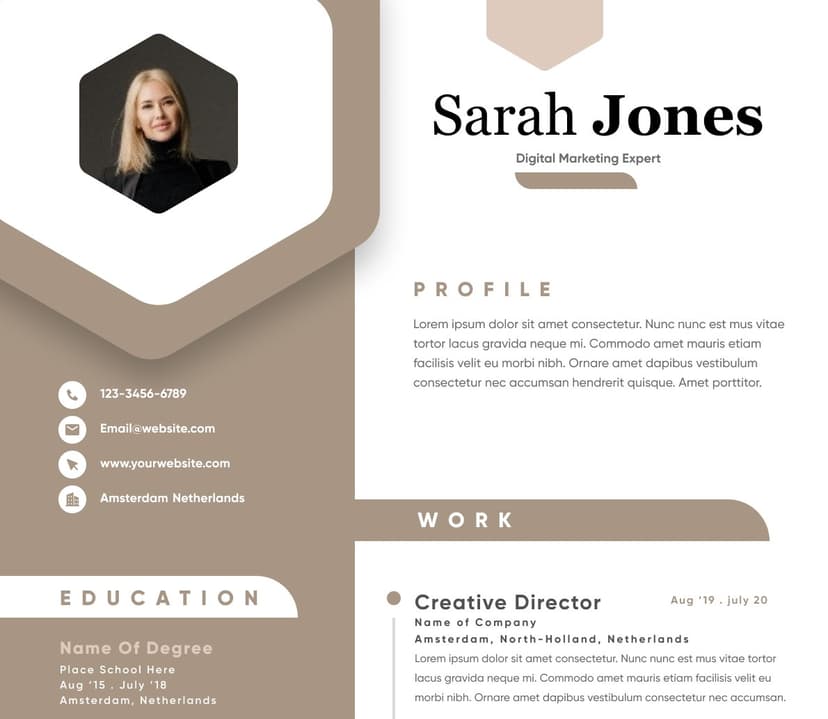
Use professional field-tested resume templates that follow the exact Resume rules employers look for.
Create Resume