Choose from a wide range of NEWCV resume templates and customize your NEWCV design with a single click.


Use professional field-tested resume templates that follow the exact Resume rules employers look for.
Create ResumeBusiness Intelligence (BI) Analyst salaries in the UK are not just about experience or job titles. They are a direct reflection of commercial impact, data maturity of the company, stakeholder exposure, and your ability to influence decisions—not just report data.
If you’re searching “BI analyst salary,” you’re likely trying to answer one of these:
What should I be earning right now?
Why am I being underpaid?
How do I increase my salary fast?
What separates £40K analysts from £90K+ analysts?
This guide answers all of that—through the lens of real hiring decisions, recruiter screening logic, and compensation strategy in today’s UK market.
Here’s the realistic salary distribution based on current hiring trends across London, remote UK, and major tech hubs:
£30,000 – £40,000
London: £35,000 – £45,000
Strong SQL + Power BI/Tableau required
£40,000 – £60,000
London: £50,000 – £70,000
Expected: stakeholder interaction + business impact
£60,000 – £85,000
London: £70,000 – £95,000
Owns reporting strategy, not just dashboards
£80,000 – £110,000+
London: £90,000 – £120,000+
Influences business decisions at leadership level
£350 – £700 per day
High-end: £800+ (specialised domains like fintech, data transformation)
Most candidates assume salary = years of experience. That’s wrong.
Hiring managers evaluate four core signals:
Can you tie your work to revenue, cost savings, or efficiency?
Weak positioning: “Built dashboards in Power BI”
Strong positioning: “Reduced reporting time by 60%, enabling £2M cost optimisation decisions”
Recruiter Insight:
If your CV doesn’t show business outcomes, you are automatically positioned in the lower salary band.
The more senior your stakeholders, the higher your salary.
Entry-level: internal reporting
Mid-level: cross-functional teams
Senior: C-suite visibility
Hidden truth: Analysts who influence decisions earn significantly more than those who only produce data.
Working with complex data environments increases your value:
Basic: Excel + dashboards
Intermediate: SQL + BI tools
Advanced: Data modelling, pipelines, cloud (Snowflake, BigQuery)
Are you told what to build—or do you define what matters?
Execution = lower salary ceiling
Ownership = higher compensation trajectory
Industry has a massive impact on pay—often more than skill level.
FinTech: £60K – £100K+
SaaS / Tech: £55K – £95K
Investment Banking: £70K – £110K
E-commerce: £50K – £85K
Retail: £40K – £65K
Logistics: £45K – £70K
Healthcare: £40K – £65K
Public Sector: £30K – £55K
Education: £28K – £50K
Recruiter Insight:
A mid-level BI analyst in fintech often earns more than a senior analyst in the public sector.
Not all skills are equal in salary impact.
Advanced SQL (complex joins, optimisation)
Data modelling (star schema, ETL logic)
Power BI / Tableau (advanced, not basic dashboards)
Stakeholder storytelling
Cloud platforms (AWS, Snowflake, GCP)
Basic Excel
Static reporting
Copy-paste dashboard work
“Knowing tools” without business application
Reality: Tools don’t get you paid. Decision influence does.
Recruiters don’t guess your salary—they benchmark you instantly.
They evaluate:
Your current salary (baseline anchor)
Comparable candidates in pipeline
Budget band for the role
Perceived impact level from your CV
Critical Insight:
If your CV undersells your impact, recruiters assume you belong in a lower band—even if you’re underpaid.
These are the patterns I see every day as a recruiter:
If you’re just producing dashboards, you’re replaceable.
Candidates list tools, not outcomes.
You stayed loyal—but your salary didn’t keep up.
Even strong analysts look average on paper.
Transform this:
Weak Example:
“Created dashboards for sales team”
Good Example:
“Developed sales performance dashboards that identified underperforming regions, contributing to a 15% revenue increase”
Volunteer for stakeholder meetings
Present insights, not just data
Ask “why” behind requests
Focus on:
SQL mastery
Data modelling
Cloud exposure
Not just more tools—deeper capability.
Most salary jumps happen during job changes:
Typical increase: 15% – 30%
Internal raises: 3% – 8%
BI Analyst → Senior BI Analyst
Senior BI Analyst → Lead / Analytics Manager
Lead → Head of Data / Analytics
Year 0–2: £30K → £40K
Year 3–5: £45K → £65K
Year 5–8: £65K → £90K
Year 8+: £90K → £120K+
Fast-track candidates achieve this quicker by focusing on impact, not tenure.
+10% to +25% higher salaries
Higher competition
More senior roles available
Increasingly competitive
Salaries aligning with national averages
Top remote roles still pay London-level for strong candidates
Stability
Bonuses
Career growth
Higher daily rates
Less security
Requires strong positioning
Who should contract?
Senior BI analysts
Specialists in transformation projects
Strong stakeholder communicators
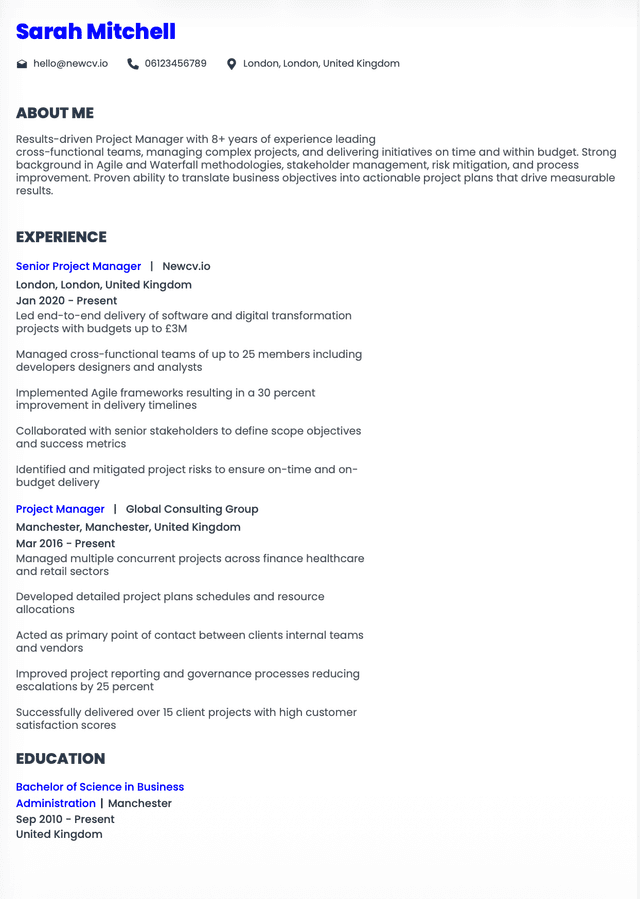
Candidate Name: James Carter
Role: Senior BI Analyst
Location: London, UK
Professional Summary
Senior BI Analyst with 6+ years of experience driving data-led decision-making across fintech and e-commerce sectors. Proven track record of translating complex datasets into actionable insights, contributing to revenue growth, cost optimisation, and strategic planning.
Key Skills
Advanced SQL
Power BI & Tableau
Data Modelling
Stakeholder Management
Snowflake & AWS
Business Strategy Alignment
Professional Experience
Senior BI Analyst | FinTech Company | London
2022 – Present
Led development of executive dashboards used by C-suite to track £50M revenue streams
Identified customer churn patterns, reducing churn by 18% through targeted interventions
Automated reporting processes, saving 20+ hours per week across teams
Collaborated with product and marketing teams to optimise conversion funnels
BI Analyst | E-commerce Company | London
2019 – 2022
Built data models supporting inventory forecasting, reducing stockouts by 25%
Delivered weekly insights influencing pricing strategy and promotions
Improved data accuracy by redesigning reporting pipelines
Education
BSc Data Science – University of Manchester
Low starting salary often compounds over years.
“BI Analyst” can range from £30K to £100K depending on scope.
Companies rarely adjust salaries to market rate unless forced.
If you don’t demonstrate strategic impact, you plateau around £60K–£70K.
Tools are expected. Impact is rewarded.
This limits your perceived value.
Market jumps outperform loyalty.
Most candidates accept the first offer without leverage.
They ask:
Can this person influence business decisions?
Are they proactive or reactive?
Do they understand commercial impact?
Will they operate independently?
If the answer is “yes,” you move into a higher salary bracket immediately.
BI Analyst salary is not about:
Years of experience
Number of tools
Job title
It’s about:
Business impact
Decision influence
Data ownership
Commercial awareness
Master those—and your salary follows.
Use ATS-optimised Resume and resume templates that pass applicant tracking systems. Our Resume builder helps recruiters read, scan, and shortlist your Resume faster.

Use professional field-tested resume templates that follow the exact Resume rules employers look for.
Create Resume