Choose from a wide range of CV templates and customize the design with a single click.


Use ATS-optimised CV and resume templates that pass applicant tracking systems. Our CV builder helps recruiters read, scan, and shortlist your CV faster.


Use professional field-tested resume templates that follow the exact CV rules employers look for.
Create CV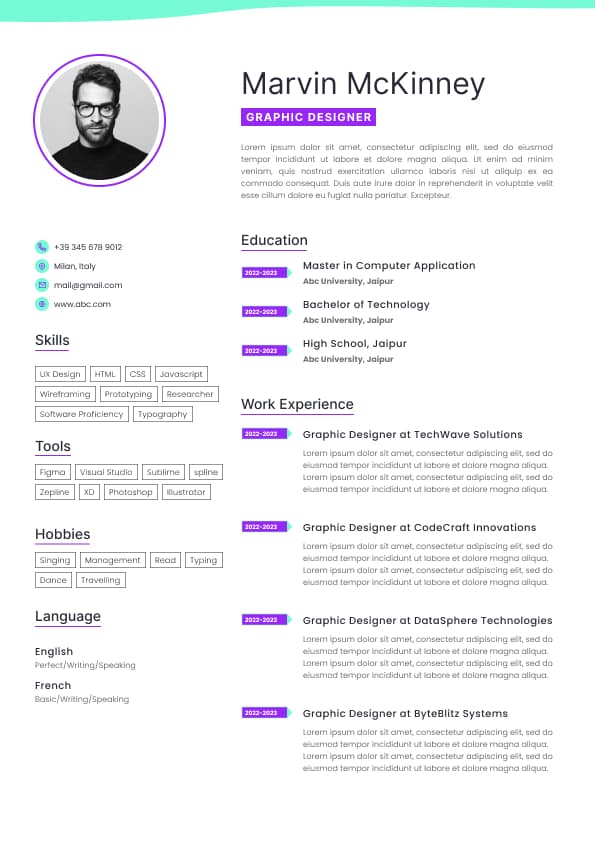
Use professional field-tested resume templates that follow the exact CV rules employers look for.
Create CVIf you’re searching “Lyft driver salary USA” or wondering “how much does a Lyft driver make per year?”, you need to understand one critical fact:
Lyft drivers are independent contractors, not employees. That means there is no fixed salary, and earnings vary dramatically based on strategy, location, and cost management.
Unlike traditional jobs, Lyft income behaves more like a micro-business model, where your revenue, expenses, and efficiency determine your real take-home pay.
This guide breaks down real 2026 Lyft driver earnings, including gross vs net income, hourly rates, bonuses, and how top drivers significantly outperform the average.
Across the US, Lyft driver earnings look like this:
Gross Hourly Pay: $20 – $35 per hour
Net Hourly Pay (after expenses): $15 – $25 per hour
Annual Earnings (part-time): $15,000 – $35,000
Annual Earnings (full-time): $35,000 – $75,000
Top 10% Drivers: $70,000 – $100,000+
Important distinction:
Gross pay = what Lyft shows you
Even though Lyft doesn’t have formal “levels,” earnings scale based on driver behavior and optimization.
Net Hourly: $14 – $18
Annual Equivalent: $25,000 – $40,000
Typical issues:
Poor route selection
Driving during low-demand hours
High idle time
Net Hourly: $18 – $24
Location is one of the biggest earning drivers due to demand density and pricing.
New York City: $25 – $40/hour (gross)
San Francisco: $30 – $45/hour (gross)
Los Angeles: $25 – $38/hour (gross)
Chicago: $22 – $32/hour
Dallas: $20 – $30/hour
Atlanta: $20 – $28/hour
Net income = what you actually keep after expenses
Recruiter-level insight:
Most online estimates inflate earnings because they ignore costs like fuel, depreciation, and downtime between rides.
Annual Equivalent: $40,000 – $60,000
Improvements include:
Better understanding of surge pricing
Strategic driving hours
Reduced downtime
Net Hourly: $25 – $35+
Annual Earnings: $60,000 – $100,000+
These drivers:
Work peak demand windows only
Optimize location (airports, events, nightlife)
Minimize dead miles (unpaid driving)
Midwest suburban areas: $18 – $25/hour
Rural regions: $15 – $22/hour
Recruiter insight:
High-density cities offer more rides but also:
More competition
Higher expenses
Regulatory constraints
Lyft drivers don’t receive traditional salaries, so compensation is structured differently.
Base fares per ride
Distance and time-based earnings
Surge pricing (peak demand multipliers)
Tips (5% – 20% of total income)
Bonuses (ride streaks, weekly challenges)
Fuel: $0.10 – $0.25 per mile
Vehicle depreciation: $3,000 – $8,000/year
Maintenance: $1,000 – $3,000/year
Insurance: $1,500 – $3,500/year
Real takeaway:
Expenses typically reduce gross income by 25% – 40%, depending on the vehicle and driving habits.
Breaking it down monthly gives a clearer picture:
Part-time drivers: $1,200 – $3,000/month
Full-time average: $3,000 – $5,500/month
High performers: $5,500 – $8,500+/month
Driving more does not always equal earning more.
Peak hours:
Morning commute
Weekend nights
Major events
Top drivers position themselves near:
Airports
Downtown areas
Event venues
Drivers who manage:
Fuel efficiency
Maintenance costs
Route planning
…keep significantly more of their earnings.
Lyft offers:
Ride streak bonuses
Weekly ride challenges
Guaranteed earnings promotions
These can boost income by 10% – 30%.
Weak Example:
Driving randomly throughout the day.
Good Example:
Driving only during surge hours and peak demand windows.
Why this works: You maximize earnings per hour instead of total hours.
Dead miles = driving without a passenger.
Top drivers:
Stay in high-demand zones
Avoid long pickups
Use destination filters
Fuel-efficient cars (hybrids, EVs) increase net income significantly.
Many drivers combine:
Lyft + Uber
Food delivery apps
Airport runs
This reduces downtime and increases utilization.
From a compensation standpoint, Lyft operates on:
Dynamic pricing
Supply-demand balancing
Driver flexibility
This creates a wide earning range because:
Some drivers treat it casually
Others operate like logistics professionals
Key insight:
The difference between a $30K driver and an $80K driver is not the platform. It’s strategy.
Lyft: slightly higher tips in some markets
Uber: more ride volume in most cities
Real-world outcome:
Most high earners drive for both platforms to maximize demand access.
Lyft driving is not a traditional career path, but it can evolve into:
Fleet ownership (renting vehicles to other drivers)
Private chauffeur services
Transition into logistics or transportation management
Flexible schedule
Low barrier to entry
Immediate income potential
No benefits
Income volatility
High vehicle-related costs
If you're evaluating “Lyft driver salary per year in the US”, here’s the realistic breakdown:
Casual drivers: $15K – $30K
Part-time consistent: $30K – $50K
Full-time average: $40K – $70K
Top 10% optimized drivers: $70K – $100K+
Key takeaway:
Lyft is not a fixed-salary job. Your income is directly tied to strategy, efficiency, and cost control. The platform provides the opportunity, but your execution determines your earnings.